
What’s Going On and What Are We Doing?
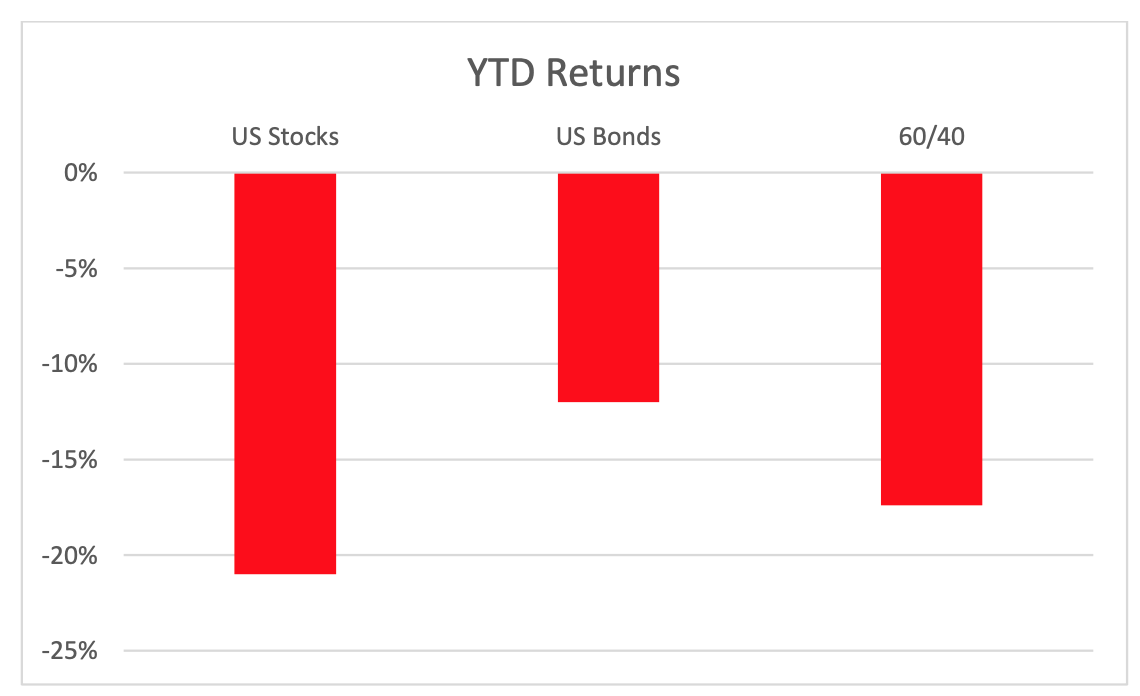
As of Monday (6/13), the US stock market has officially hit Bear Market territory (i.e., a fall of at least 20%). The S&P 500 closed down some 21% year-to-date. The tech-heavy NASDAQ 100 closed down almost 31% year-to-date. This is considered normal, as so-called bear markets tend to occur every several years. The last one was during the beginning of the pandemic when equities fell some 30%, only to then bounce up about 50%, based on today’s values. Meanwhile, US bonds, as measured by AGG, are down a whopping 12% year-to-date. This kind of drop is not normal, and it hasn’t happened in about 40 years. Consequently, a conventional 60/40 stock/ bond mix is down over 17%. The chart below summarizes these values.
What in the world is going on?
Inflation. Persistent inflation. We originally started seeing inflation brewing over a year ago, coming from pandemic-induced demand and large amounts of stimulus. However, Russia’s invasion of Ukraine created a second round of inflationary pressures, as the cost of global energy and food have shot up due to supply disruptions. The cost of energy can impact the price of almost everything.
How does high inflation affect financial markets?
Central banks typically raise short-term interest rates to curb inflation. The speed of an economy is inextricably tied to the cost of money, which is the interest rates. Thus, by raising interest rates (i.e., making money more expensive), a central bank will slow down the economy. The trick, and this can be a very difficult trick to pull off, is to avoid a hard landing, mainly slowing down the economy so much it enters into recession. A successful (i.e., no recession) central bank-induced slowdown is called a “soft landing.” Thus, increased inflation can cause both increased chance of recession and higher interest rates, both of which are bad for stocks, as a stock is nothing more than ownership of future profits. A recession means less profits and higher interest rates, which means that the future flow of (reduced) profit streams are worth even less (since they are discounted at a higher interest rate). Higher rates often also mean higher interest rate expense for companies, which results in lower profits. All the while, the current price of most bonds is inversely related to interest rate moves. If you bought a 3% yielding 10-year bond and then the 10-year rate rises to 4%, the current value of your bond will fall. Similar logic shows increased inflation also means that when your bond matures in 10 years, it will be worth less in today’s dollars, which means it becomes worth less today. In sum, high levels of inflation are harmful to both current conventional bond and stock prices. Of course, there are some investments that can survive, if not thrive, during a high inflationary period, which we discuss at the end of this commentary.
How long will this high inflation last?
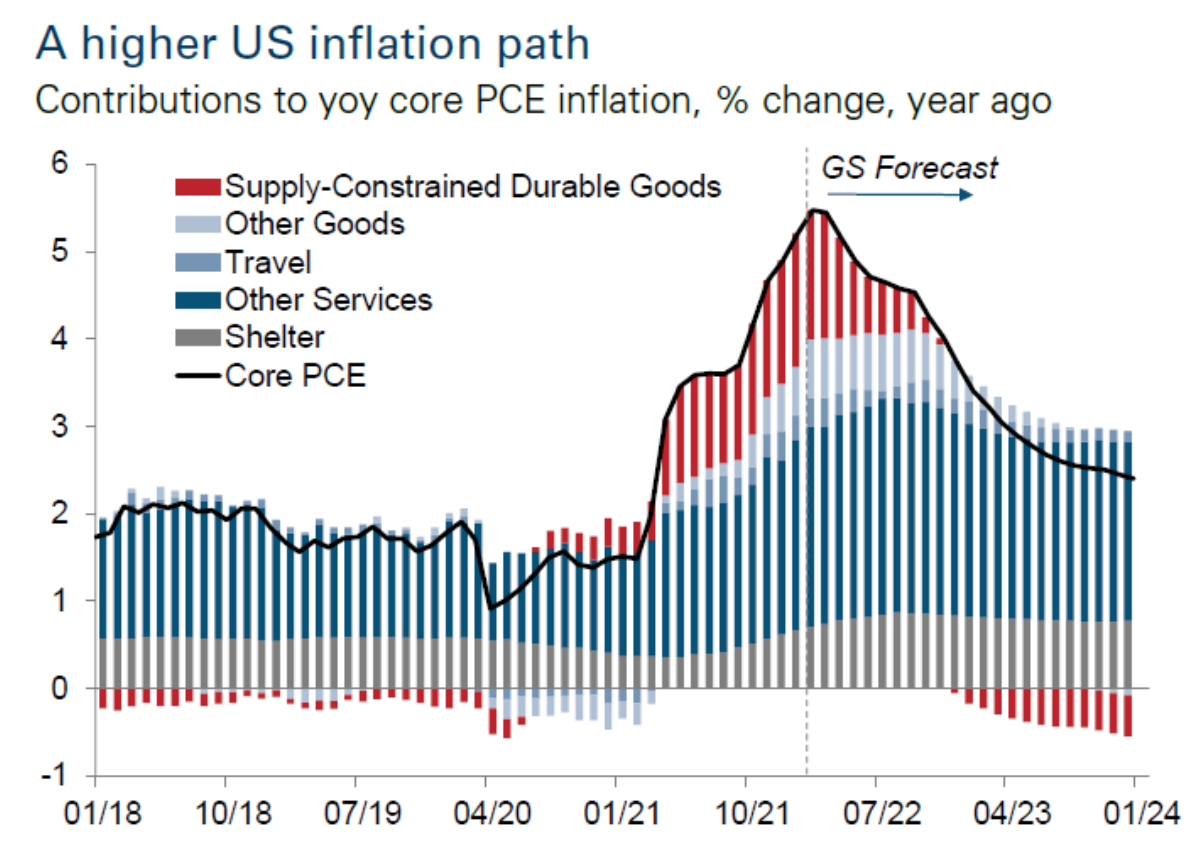
A recent forecast by Goldman Sachs, which is largely consensus view, including our own, shows inflation will likely take another 12 months to return to some version of normalcy. Here is a chart that summarizes the Goldman forecast:
Note this is 12 months to normalcy, and not 12 years. Thus, in terms of personal finances, we can consider what we can do to help assuage this current sting of inflation. Later, we will discuss what we have been working on in terms of portfolio management moves.
Here is a zoomed-in version of what has happened most recently with core and overall inflation:

As can be seen, there are some hints that core inflation might even have peaked out.
So, what can I personally do about high inflation?
Although we certainly can’t unilaterally change an inflation rate, we can change how we respond to inflation. The first step we recommend is for you to calculate your personal inflation rate. The most recent inflation reading for the US showed that the average cost of goods and services in the US grew by close to 9% over the past year, as measured by the Consumer Price Index (CPI). The so-called core CPI, which strips out the volatile price categories of food and energy, rose 6% over the past 12 months. However, CPI is simply a “typical” basket of goods and services and might not be how you spend your money. Here is the current breakdown of CPI:
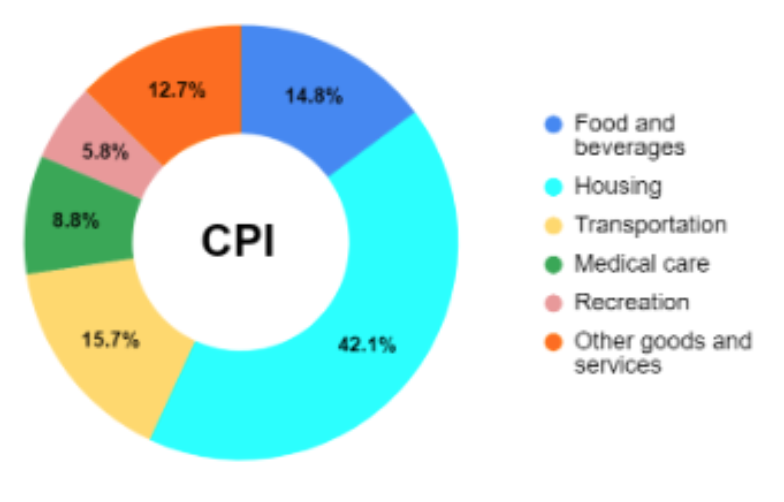
Note almost half of the CPI is housing, which is higher than what most of our clients spend on housing. Here are how the broadest categories grew over the past 12 months:
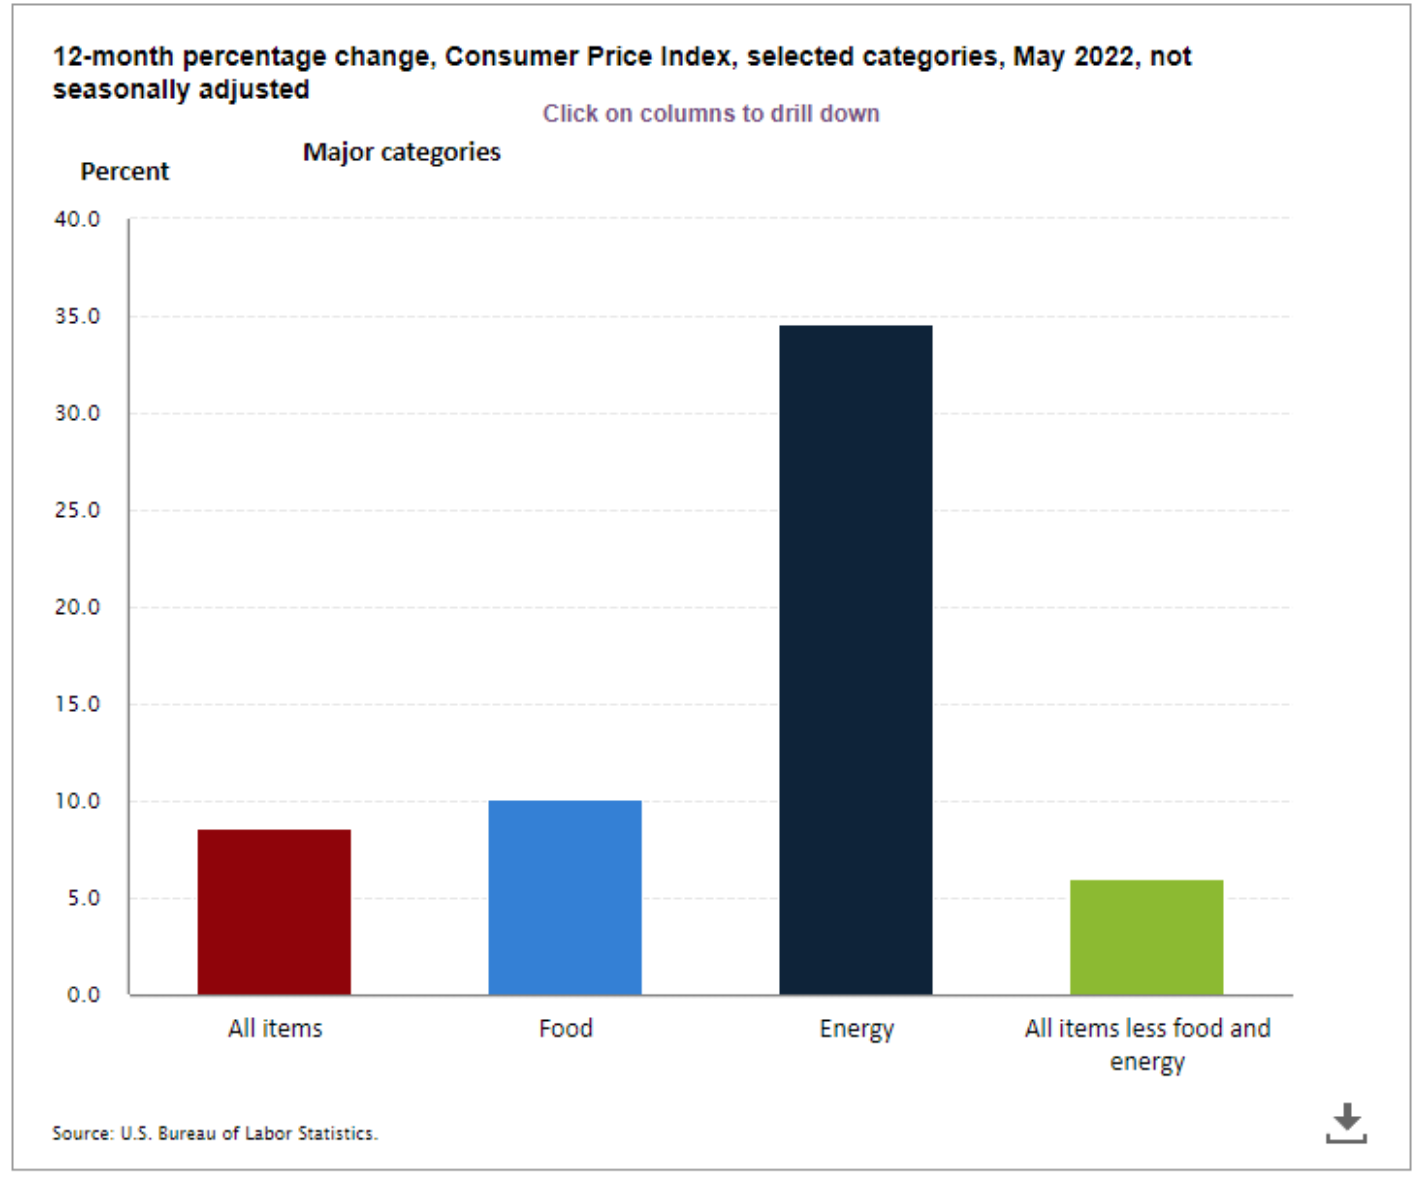
can find these this chart and other ones from the US Bureau of Labor Statistics website here.
The below table is a more granular version of the trailing 12 months of inflation.
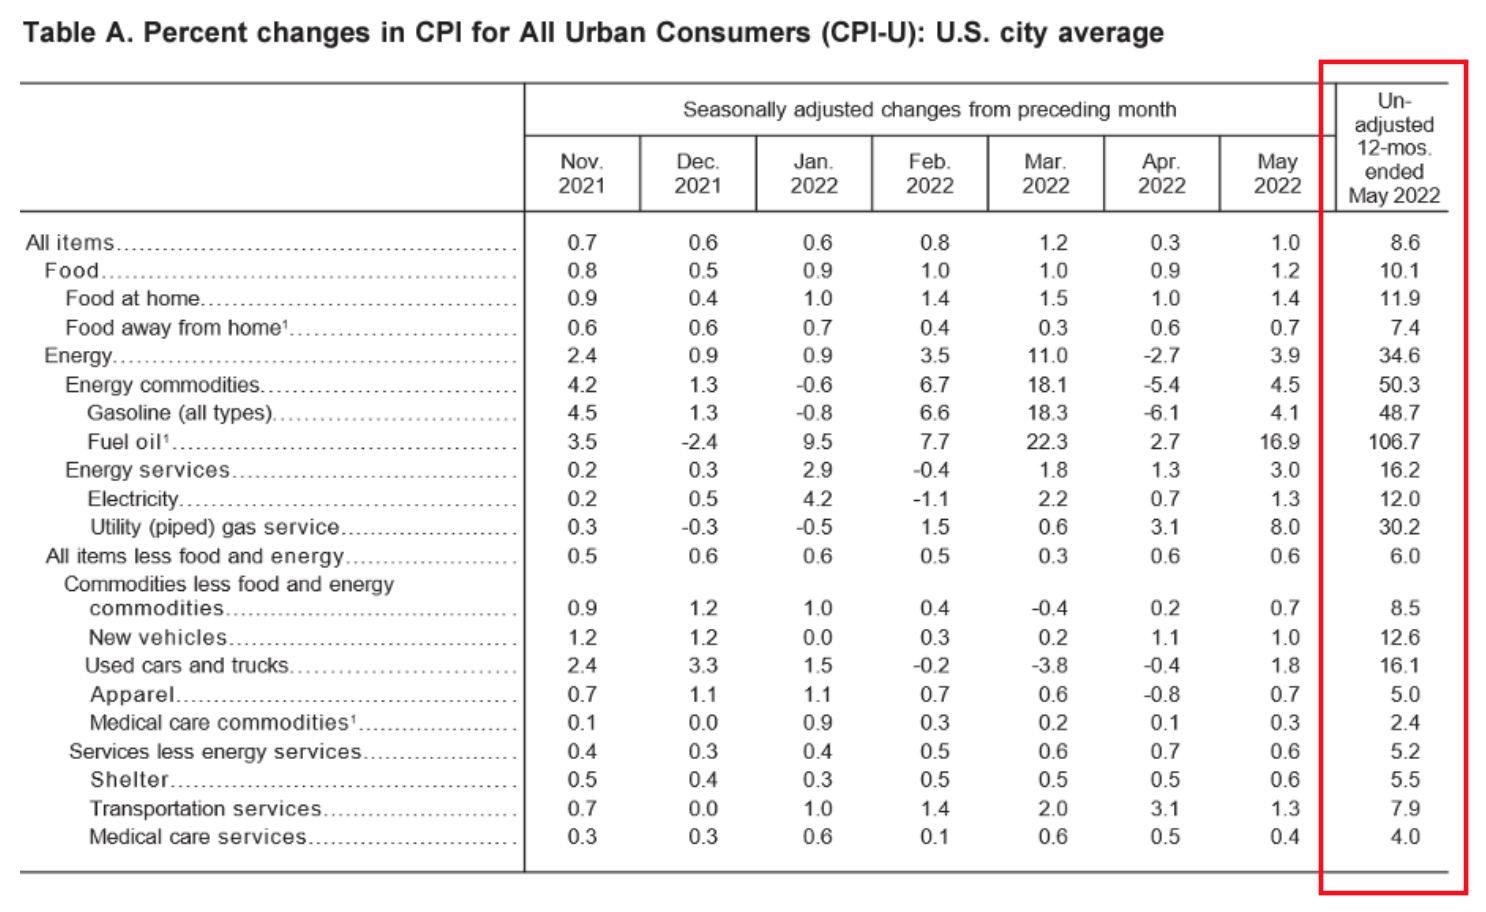
A simple approach would be to figure out over the past 12 months how much in percentage terms you have been spending on food, energy, and all other items, and then multiply those percentages by 10.1% (food inflation), 34.6% (energy inflation), and 6% (all other categories), respectively. If the answer equals 8.6%, your inflation has been similar to the typical “Urban Consumer.” Of course, those quantitatively inclined could break their spending down to the finer categories above and figure a very accurate 12-month personal inflation rate.
Knowing your personal inflation rate is helpful because you can use it to see how much more you need to maintain that same spending, and it also can provide an opportunity to identify potential areas of spending you could shift around to blunt some of the effects of inflation. For example, with gas being up 50% this past year, perhaps a long RV trip might not be the best use of funds right now. As another example, the cost of eating out has grown more slowly than eating at home. Alcohol, especially, wine has grown in price only a little. The implications are obvious.
There are some other strategies of dealing with inflation as follows:
- Be on the lookout for some “deals.” Assuming items are non-perishable, you can accelerate purchases. You can also buy in bulk.
- Think about what items make you most happy. This can help prioritize spending.
- Emphasize experiences over things: the former has realized much less inflationcompared to things (and sometimes no inflation, depending on the experience)
- Drink more wine. Happily, the inflation for wine has been minimal. If visiting our office, consider a tasting at all the surrounding wine rooms. This takes no extra gas.
- Spend more time with good friends and family. This helps well-being, and is usually lower cost than a new couch.
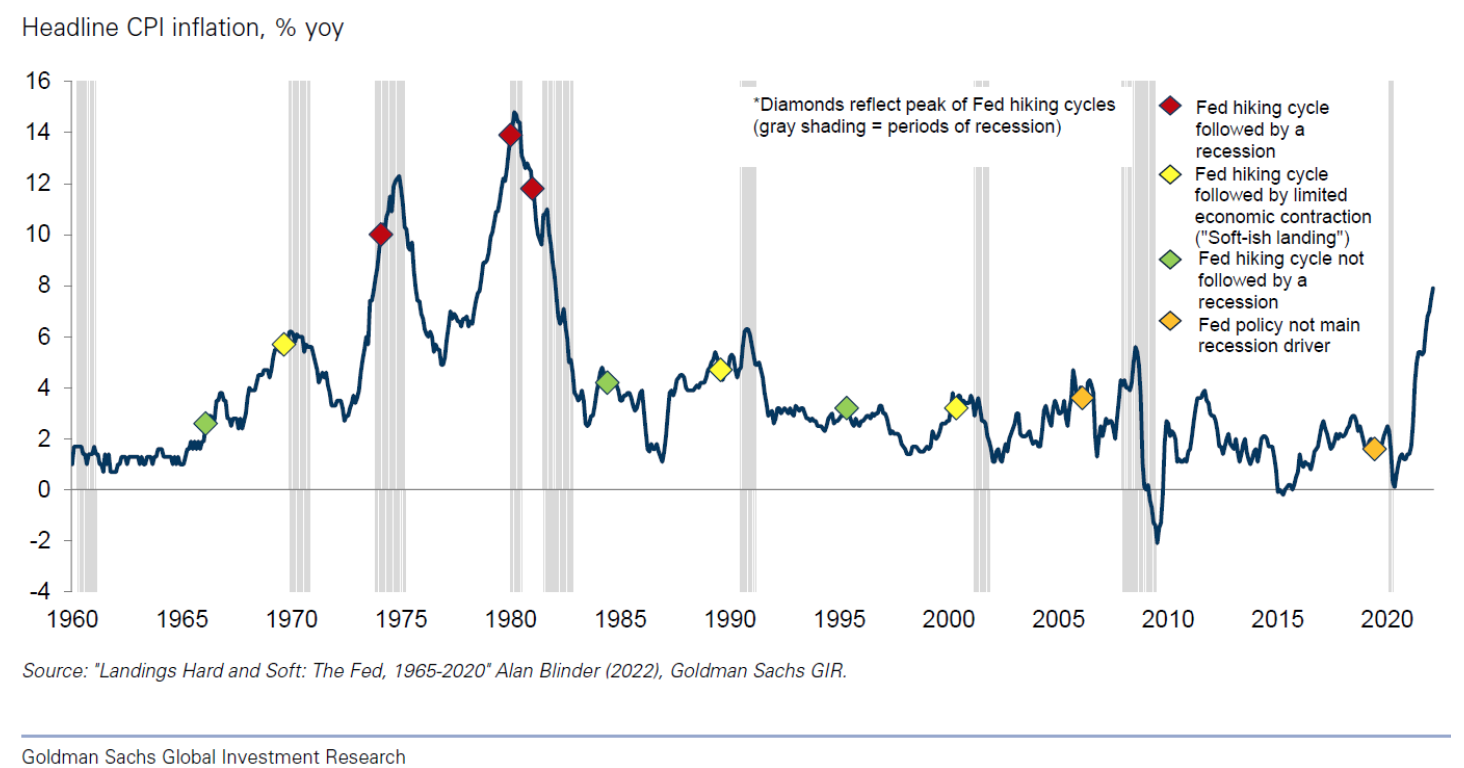
Above, we already discussed when this high inflation might end (i.e., in about 12 months), the next question is how will this end? In particular, many are concerned we might be falling into a recession. For perspective, we fall into a recession every 7 years, on average. Since the average recession lasts a bit over a year, this means we’re in a recession a bit under 20% of the time. A big question, then, is will the FED push us into a recession prematurely through their need to tamp down inflation. We just had our last short, albeit very deep recession, in 2020. Below is a chart that reports rates of inflation since 1960, as well as all the times the FED tightened interest rates (diamonds) and periods of inflation (gray bars).
But won’t we have a recession since we just entered a Bear market, too?
It is true that a Bear Market predicts a higher chance of a recession—about 50% vs. 15% for any given year—but it is far from certain. Whatever the case, I just got invited to attend the Summer National Bureau of Economic Research (NBER) meetings late next month in Boston. These meetings are invite-only for a small set of economists to explore various current economic issues, and I am honored that they invited me. The NBER is also the official body that dates US recessions. I will report back any interesting findings!
So, what is Omega doing during this time?
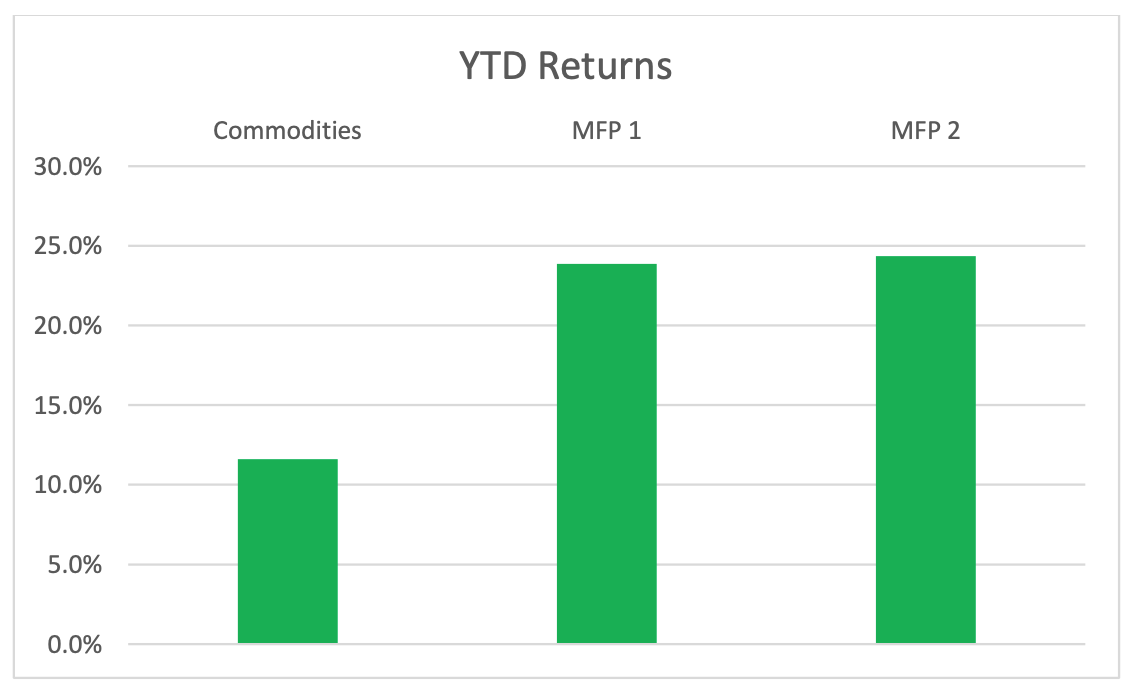
First of all, there are some assets we have been investing in that are not down 13-30%, like conventional assets. For example, managed futures and commodities, which the typical portfolio has close to 10% invested in are actually up 12 to 24% year-to-date (see below chart). In addition, we have been adding private credit, which is also generally up some while conventional bonds are down roughly 12%. Private credit provides an opportunity for premium yields—typically 7-9%–versus 3-5% for the “public market.” The tradeoff is private credit is not as liquid as conventional, or public market, credit. Commonly you can sell out of a private credit portfolio on a quarterly or annual basis, as opposed to daily of a public credit fund. Another important feature of private credit is that many of the loans are floating rate, which means as interest rates rise, rather than primarily losing principal value, you instead receive a higher interest rate.
Another excellent opportunity we have been pursuing has been tax harvesting. It is uncommon, as previously discussed, to have conventional bonds drop so dramatically. We are taking advantage of this drop by strategically harvesting losses to reduce your taxes, where we can. Unlike when we harvest equity losses, the likelihood of bonds shooting up in value is very low. In fact, the most likely view is for conventional bonds to lose a bit more value before the end of the year.
Of course, as in all times, we do not know for sure what will happen in the next year. This is why will still maintain a broad swath of investments that can survive and thrive in different economic environments. This is something we’ve done since the beginning. This is also crucial to be able to effectively take distributions from a portfolio: we can take from the most sensible assets as possible. That is, even when the whole portfolio is down, we can strategically extract funds from the portfolio in such a way to minimize its impact.
In the end, the most important thing financially, in our view, is to make sure that we are curating a strategic plan that will take us where we want to go. In this spirit, we look forward to reviewing your progress at your next review. In the meantime, if you have any questions or concerns, as always, do not hesitate to reach out, as we are working hard here to serve you.