
The Good, the Bad, and the Confusing
“If you’re not confused, you’re not paying attention.”
Tom Peters (author of In Search of Excellence)
The Good
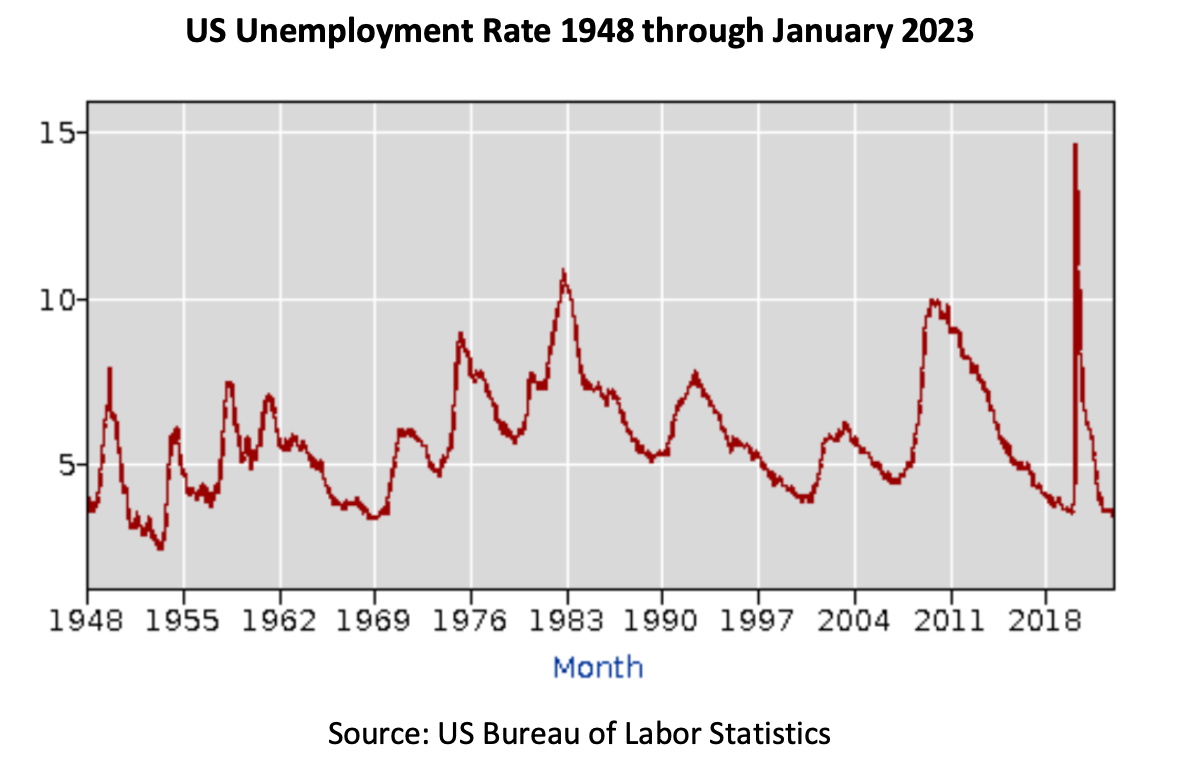
Have you heard about the recent “terrible” economic news?
Unemployment is at its lowest level in over 50 years, as shown by the below graph:
Meanwhile, there is still a 2% larger gap between jobs and workers than there was in December 2019 in the US. In terms of numbers, in the US, there is an estimated 5 million more jobs available than unemployed people. As the chart below shows, there is also still a larger jobs- workers gap for the UK, France, Germany, Canada, and Australia.

In other words, the labor market is now stronger globally than it was before the pandemic. That is, things are going so well economically that we do not have enough workers to fill all the needed positions. Isn’t this good news?
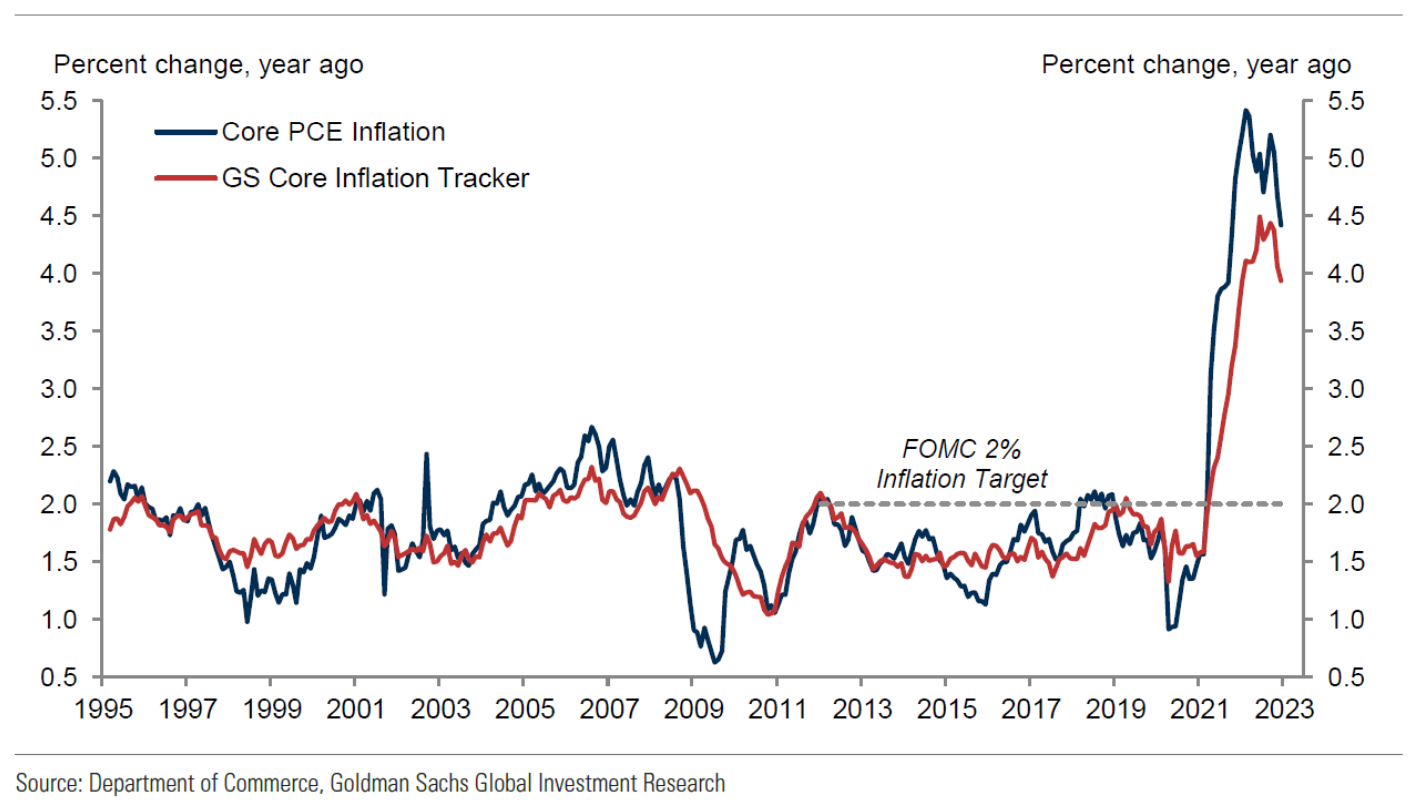
Meanwhile, inflation, which has been a great economic concern, seems to have peaked, as shown by the below chart. The trailing 12 months of core inflation has fallen from a high of about 5.5% to less than 4.5%:
In addition, we can now earn 4% on our savings accounts, a great jump from the roughly zero we faced for many years. And we can earn even more for loaning our money to a company through a corporate bond. We have largely also made it through the Winter without another wave of economic-busting COVID. We continue to realize remarkable technological advances like artificial intelligence with promising applications, such as ChatGPT. These things sound, well, kind of good. So why is the stock market so “bad” again? It feels like up is down and down is up. What is the key to solving this riddle?
The Bad
Interest rates.
The following chart reports the value of US Stocks (blue line) and US Bonds (orange line) as the Federal Reserve has begun raising interest rates (white line) from almost zero last Spring to over 4.5% most recently.

As can be seen, there is a clear negative relationship between interest rates and stocks and bonds, but why?
For stocks, it is an easy explanation. First, most companies have a substantial amount of debt. As interest rates go up, eventually a company’s expenses go up as its payments on its debt increase, which directly reduces its profit and thus all things equal: less profit means a company is worth less. A second reason a company necessarily becomes worth less (i.e., its stock price drops) is, as rates go up, the current value of future earnings (i.e., profits) go down. That is, when interest rates are higher, a dollar in the future is now worth less. In the end, a company’s valuation can be thought of as the present value of all of its future cash flow. Thus, as rates goup, this present value necessarily goes down, as it no longer takes as much money today at the new, higher interest rate to equal the future cash earnings.
For conventional bonds, on the other hand, the relationship is more tricky. In the short term, just like for stocks, there is a negative relationship between the return on bonds and rising interest rates. This is because if a bond pays a fixed rate, for example, of 3% for 10 years and then rates go up to say 4% for a 10-year bond, that existing bond will have to be worth less to pay the equivalent of a 4% bond. However, depending on how much of an increase and the maturity of the bond (i.e., when the bond finally pays back its principal to its owner), higher rates can translate into higher future returns. That is, in the longer term, there can be a positive relationship between rising rates and bond returns. For example, consider the 10-year government bond. In 2022, it started at about 1.5% but ended 2022 close to 4%. This increase in yield caused the current price of the bond to fall. However, now new bonds could be purchased to lock in the higher rate and the old bonds could be sold at a tax loss. In sum, if holding the new bonds long enough, the net result can be improved financial net worth. So, in the longer run, rising interest rates can be helpful for fixed income. And most of us are longer run investors.
In addition, we invest a material amount of funds, where appropriate, in private credit. A lot of private credit has floating rates, so as interest rates rise, so does the payout, which helps further offset a loss in principal value that might occur.
The Confusing
This all makes it a bit confusing in regard to what’s going to happen going forward and what we should do about it.
Most likely, due to the higher yield environment, we will experience better bond returns and more modest stock returns (vs. long-run average). The good news is this means returns should spring back, at least partially. Historically, this is true following a 10%+ fall in value of a balanced portfolio, as the below chart shows.
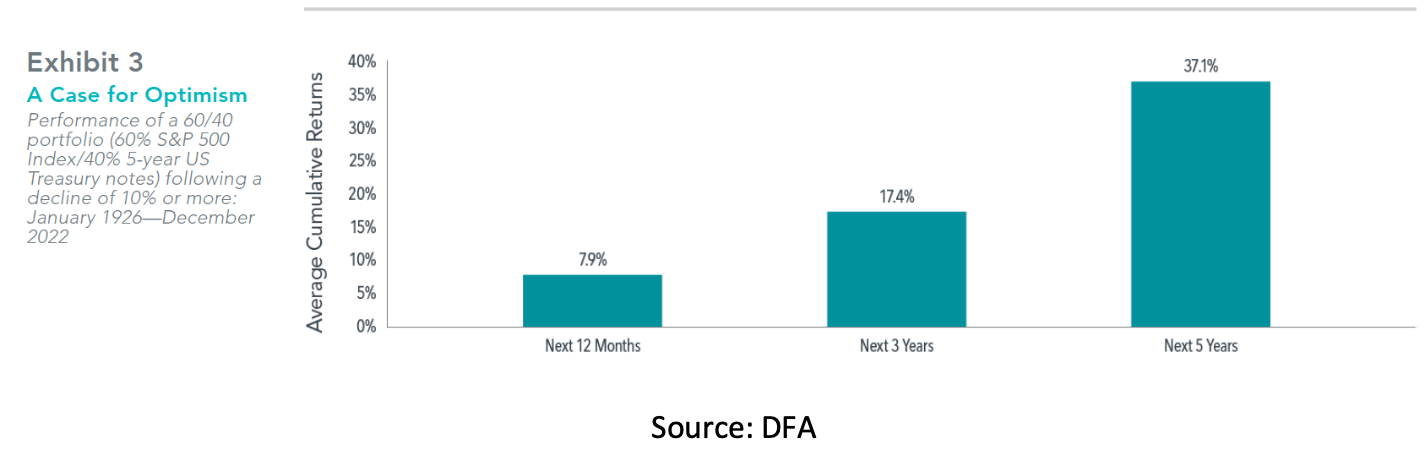
In particular, the chart reports the average 12 month, 3 years, and 5 year return following a 10% or greater fall in a 60/40 mix of stocks and bonds, with data going all the way back to 1926. For example, 5 years after such a drop, the average total return is over 37%.
Of course, past performance is no guarantee of future performance, so what should we do? Naturally, we want to make sure, as we always do, to take advantage of our States of the World® investment process where we have investments that can survive, if not thrive, in different types of economic environments.
The other piece we have increasingly added is small investment exposures that carry limited downside with outsized upside. An example of this is two years ago we added a small piece of commodities exposure (~3%) which returned over 20%. Similarly, this past year when conventional stocks and bonds fell some 20% and 15%, respectively, we had about 5% exposure to managed futures funds, on average. This small amount added about 2% to the overall portfolio return.
For this year, where appropriate, we are adding some warrant investments that provide an even greater opportunity for upside with limited downside. For a typical case, we might allocate 1% per annum to provide a net 2% additional annual portfolio return potential over the next couple of years. This could also potentially aid in the possibility of a more modest asset return environment. So, stay tuned!
Meanwhile, as always, we continue to scour the financial landscape for additional opportunities to maximize your portfolios, minimize risk, and strategically plan your overall financial well- being. Should you have any questions or concerns before our next review, do not hesitate to reach out!