
Inflation: What is it, Why is it, and What to do about it?

“Inflation is as violent as a mugger, as frightening as an armed robber and as deadly as a hitman.”
Ronald Reagan
“A nickel ain’t worth a dime anymore.”
Yogi Berra
We have had many clients ask about inflation recently, so this is a good time for a primer! We will discuss some of the basics of inflation, bring us up to current events, and end with what we are doing about it. If you are well versed in inflation, please feel free to jump to the third section.
What is inflation?
Inflation is simply the price of goods and services increasing. Of course, prices often change at different rates for different items. To deal with this reality, the US government created the Consumer Price Index (CPI) to track how much the prices of things go up for a typical American. This is done by creating a basket of goods that is weighted by the proportions of which a typical American buys the various items. The individual price changes are then aggregated up based on their weighting to create an overall change in the price of goods and services.
The following pie chart provides the current breakdown in percentages of the currently used CPI basket:
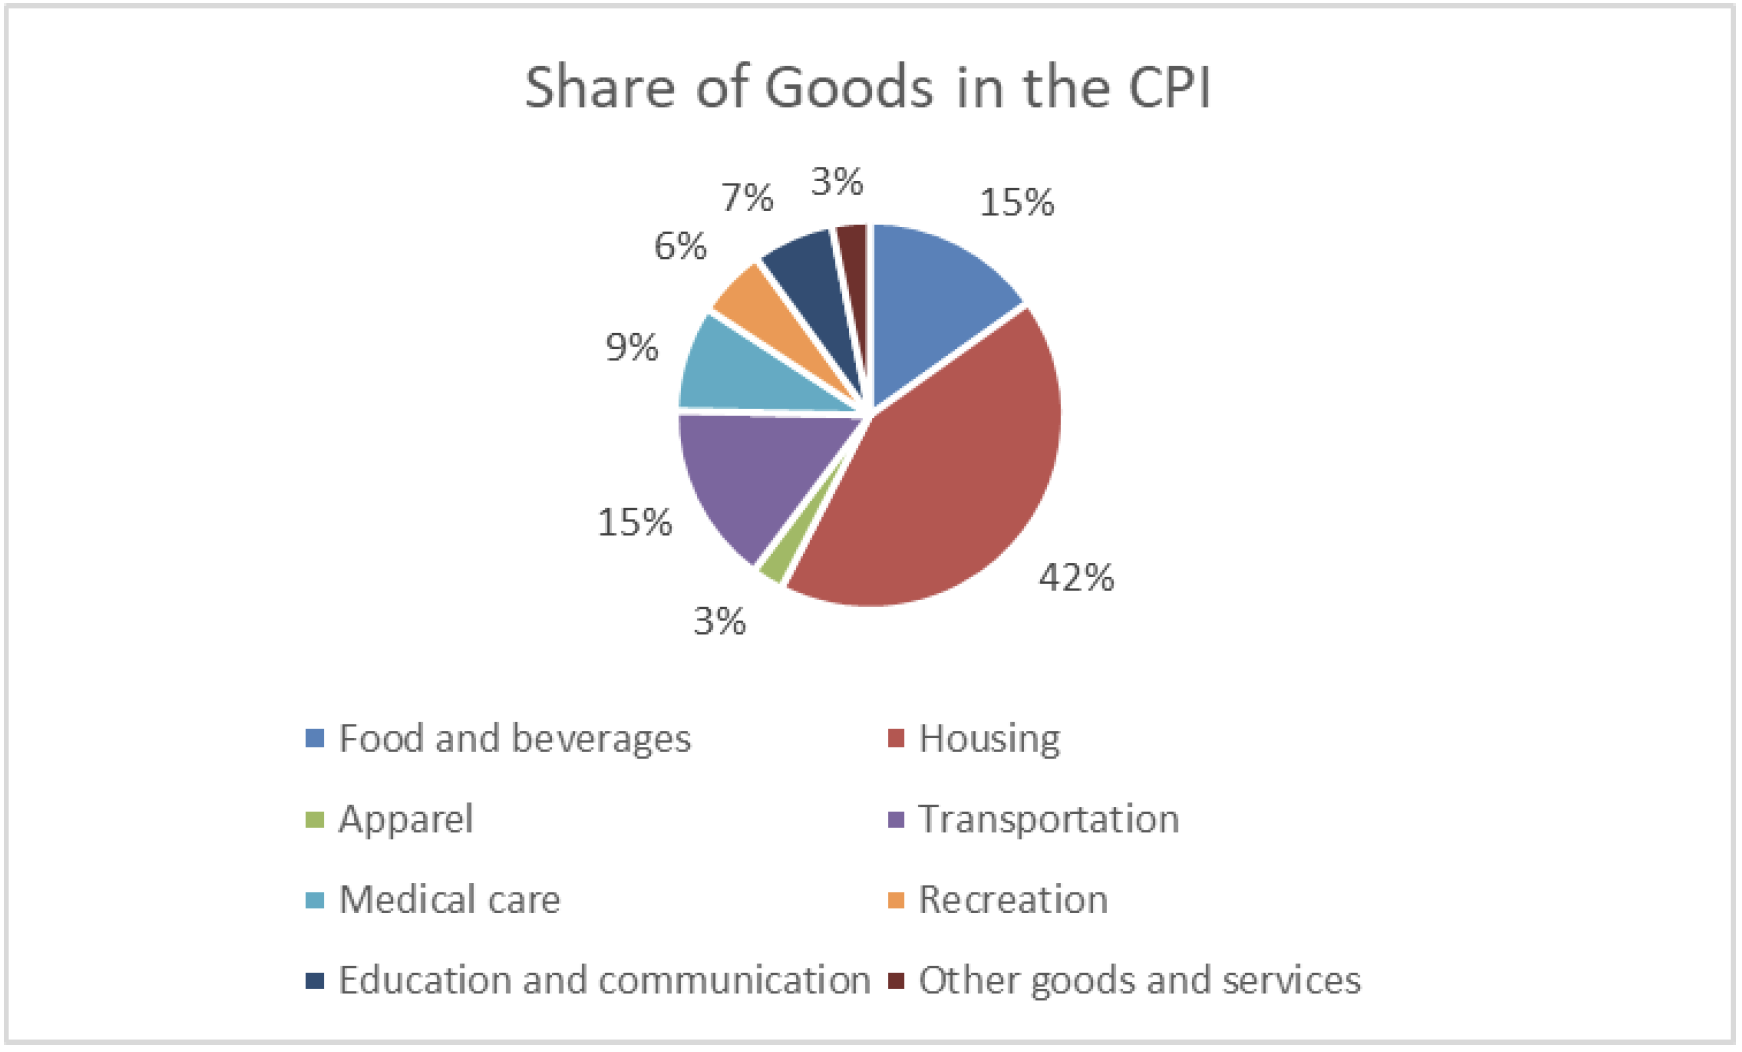
As the pie chart shows, over 40% of the spending for the typical American is on Housing-related items. In contrast, only 3% of the typical spending is on apparel. Thus, a change in housing costs will greatly dwarf any potential changes in apparel items, in terms of changing the measured inflation.
The CPI is an important measure, not only for understanding how the cost of living is changing for the typical American, but also because many programs, such as Social Security, are directly linked to the CPI index. For example, one’s monthly social security payments are annually increased at the rate of the CPI.
Over the long run, on average, US inflation has been about 3% per annum. Of course, there are periods that have strayed meaningfully from this, as can be seen by the below chart that measures the annual US inflation rate across time since 1950.
Note: 2021 is through June.
Most recently, through June of this year, inflation was roughly 5.5% for the trailing 12 months. This increase has ignited a lot of debate about how lasting our return to high inflation will be. However, this most recent 12 months included used car prices increasing in value by a whopping 45% and energy prices increasing by about 25%. If it wasn’t for energy and used vehicles, inflation would have been close to the long-run average. Further, the recent jump is based on a comparison to a weak economic period brought on by the pandemic.
This relatively narrow cause of the jump in inflation can be seen from the below chart that shows the proportion of inflation coming from commodities (mostly energy) versus the balance of items (i.e., “Core Items”). The former is portrayed by the red bars and the latter by the blue bars. In addition, future inflation estimates from Goldman Sachs are included, which show a declining inflation trend as commodity prices normalize. Note how commodities were a drag to the inflation rate during the depths of the pandemic. This all suggests a stabilizing and normalizing of overall prices going forward.

More broadly, market participants have lowered their expectations of inflation, as the roots of the recent spike in CPI have been illuminated. The below chart shows the recent shift from higher to lower inflation expectations. In particular, a short while ago, as implied by the options market, 55% of participants believed that inflation would exceed an average 3% annualized rate over the next five years, whereas now this figure is at about 40% of participants. Further, currently some 20% of participants forecast that inflation will average below 2% over the next five years.

Looking forward, we are currently using 2.6% as our long-run inflation forecast. Meanwhile, the Federal Reserve currently targets a long-run average inflation rate of 2% per annum. That is, the Federal Reserve seeks a modest inflation rate, which begs the question, why do we even have inflation?
Why do we have inflation?
Inflation can arise from either supply or demand-side considerations. A textbook explanation of inflation is that it occurs when there is an increase in money supply beyond an increase in production. In other words, if more money becomes available to people than what is available to purchase, this will increase prices through increased demand. For a recent example: with large amounts of US stimulus checks and people wanting to fix up their homes, home improvement costs experienced a jump in price, at least initially as everyone scrambled to buy the same goods and services.
In addition to demand-side reasons, inflation also comes from supply-side issues. When there is a disruption to the available supply, this can also increase the price of goods. For example, if there is a disruption to oil production facilities due to natural disaster or war, this can then increase the price of oil (as well as goods made from oil).
For another simple example, let’s imagine a winery is planning on selling 100 bottles of wine this year. If the number of people that want to buy those 100 bottles goes from 50 to 200 people (perhaps stimulus checks?), the winery will likely sell them for much more with all of the people clamoring for the same bottles. In addition, if, alternatively, for the year this wine was bottled the climate was a poor one resulting in fewer grapes being produced, there would be fewer than 100 bottles of wine for sale, which means the bottles would likely sell for even more per bottle.
So, in short, an imbalance in supply and/or demand is what creates inflation. And a healthy, growing economy will normally exhibit modest inflation, as supply and demand equilibrate in the face of such growth.
What to do about it?
At first blush, it might not seem crucial to plan for inflation if it is only 2% to 3% per annum. However, even at these lower levels, it can have a meaningful impact on one’s financial life.
For example, what was the price of milk 30 years ago? It was about $.90 per gallon. Today, depending on exactly how the cow was treated that made the milk, you can pay around $4 per gallon. This means at this inflation rate, if you retire today with $100,000 of spending, you’ll need over $400,000 per year in 30 years to buy the same amount of milk. Of course, you could engage in intermittent fasting and cut your food intake, but you would still need over $200,000 per annum. At 3% inflation, it takes about 23 years for the value of things to double, which means one needs to have double the amount of money to maintain the same purchasing power.
The idea that our money becomes worth less and less over time is called inflation risk. Even since the last commentary I sent out, your money is now worth less. So, if we just keep all of our money in cash we will simply run out of money, albeit very safely.
Instead, to counter this inflation risk, we must then make sure that, over time, our money is earning a greater return than inflation. This, of course, means we need to take some market risk. Market risk is the risk of the value of an investment fluctuating as a result of its market doing so. At Omega, we participate together in many different markets, between stocks and bonds all around the globe, as well as commodities, real estate, and private investments.
The below table illustrates this tension between inflation and market risk. In particular, it shows that the notion of risk is inextricably tied to timeframe. After one year, if you keep $5,000,000 all invested in cash, after inflation, we would expect it to lose about $130,000. And the chance of losing some value after inflation is roughly 100%. In contrast, a moderate strategic portfolio (i.e., “O6”) would expect to make roughly $244,000 after inflation after 12 months and carry only a 33% chance of losing money after inflation.
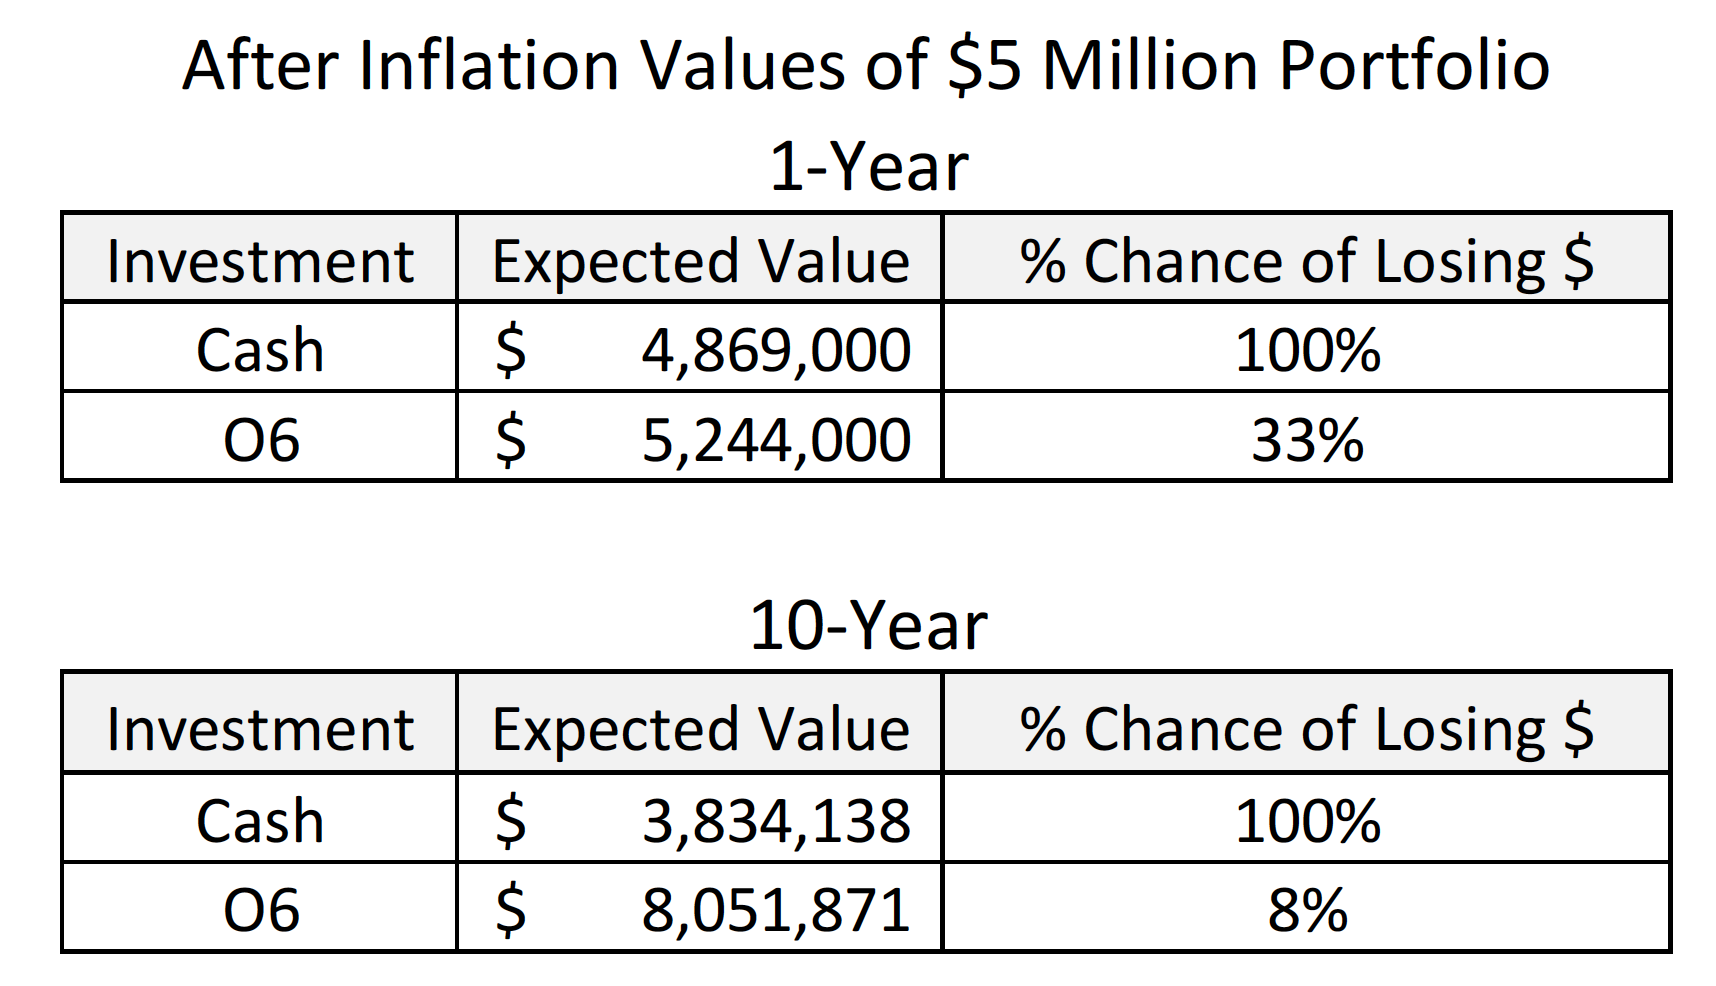
Even more interesting to me, is then looking at a 10-year timeframe. Here, keeping the $5,000,000 in cash creates an expected loss of about $1.2 million, with a roughly 100% chance of not keeping up with inflation and thus losing value after inflation. In contrast, the moderate strategic portfolio has an expected value of making some $3 million and carries only an 8% chance of not at least keeping up with inflation.
In addition to making sure your money has sufficient growth opportunity to overcome the erosion of inflation, our view is to also invest in some more sophisticated assets that have the nature to explicitly outperform in inflationary environments. After all, with our States of the World Wealth Management®, we want to have assets that can do well in low, moderate, or high inflation environments.
Four different types of investments that we use to help during higher inflation states of the world are: real estate, short-term bonds, commodity funds, and private credit. We have, for a while, held a significant portion of our portfolios in real estate and short-term bonds, which can perform especially well during higher inflation. We increased our commodity fund exposure late last year, which has helped us this year, as these funds have enjoyed large YTD returns. Finally, we have also increased private credit exposure this past year. Private credit tends to be much more idiosyncratic during rising rate environments. Private credit is also mostly short-term and many positions have floating rates that adjust as rates rise. Finally, private credit tends to earn a 3-5% premium over public credit, which makes it especially likely to exceed inflation over time.
So what will happen next? I know for sure that the inflation rate this next year will go up, down, or stay the same. But I am mostly sure inflation will be increasing at a lower rate this next year. Nonetheless, we can rest in the comfort that we have deployed different assets for these different potential environments. Meanwhile, as always, if you have any questions or concerns do not hesitate to reach out to us directly.
Omega Financial Group, LLC is a Registered Investment Adviser. This commentary is solely for informational purposes. Advisory services are only offered to clients or prospective clients where Omega Financial Group, LLC and its representatives are properly licensed or exempt from licensure. Past performance is no guarantee of future returns. Investing involves risk and possible loss of principal capital. No advice may be rendered by Omega Financial Group, LLC unless a client service agreement is in place.