
3rd Quarter 2018: When Markets Fall: Trick or Treat?
When markets fall it can be scary. Maybe a bit like a haunted house during Halloween? You know it should end up ok in the end; but the way through is nonetheless unnerving, possibly very unnerving. Perhaps you won’t even want to see your way to the end?
In this quarterly commentary, I share what has happened most recently, compare this to what tends to happen, consider what might happen, and close reflecting on how sometimes, surprising as it might be, falling markets are to be expected and can even be helpful.
According to data provided by FactSet here are some recent stats about the S&P500: Some 250 stocks are down 20% or more from their all-time closing highs, 162 are down at least 30% from their all-time highs, 113 are down at least 40% from their all-time highs, and 69 were down at least 50% from their all-time highs. This is kind of scary. Meanwhile, more broadly stocks are down roughly 6% to 9%, depending on which stock
market we measure. How normal is this?
Below is an interesting chart from DFA, which reports the return of large US stocks for each calendar year, as well as the maximum and minimum returns for the year:
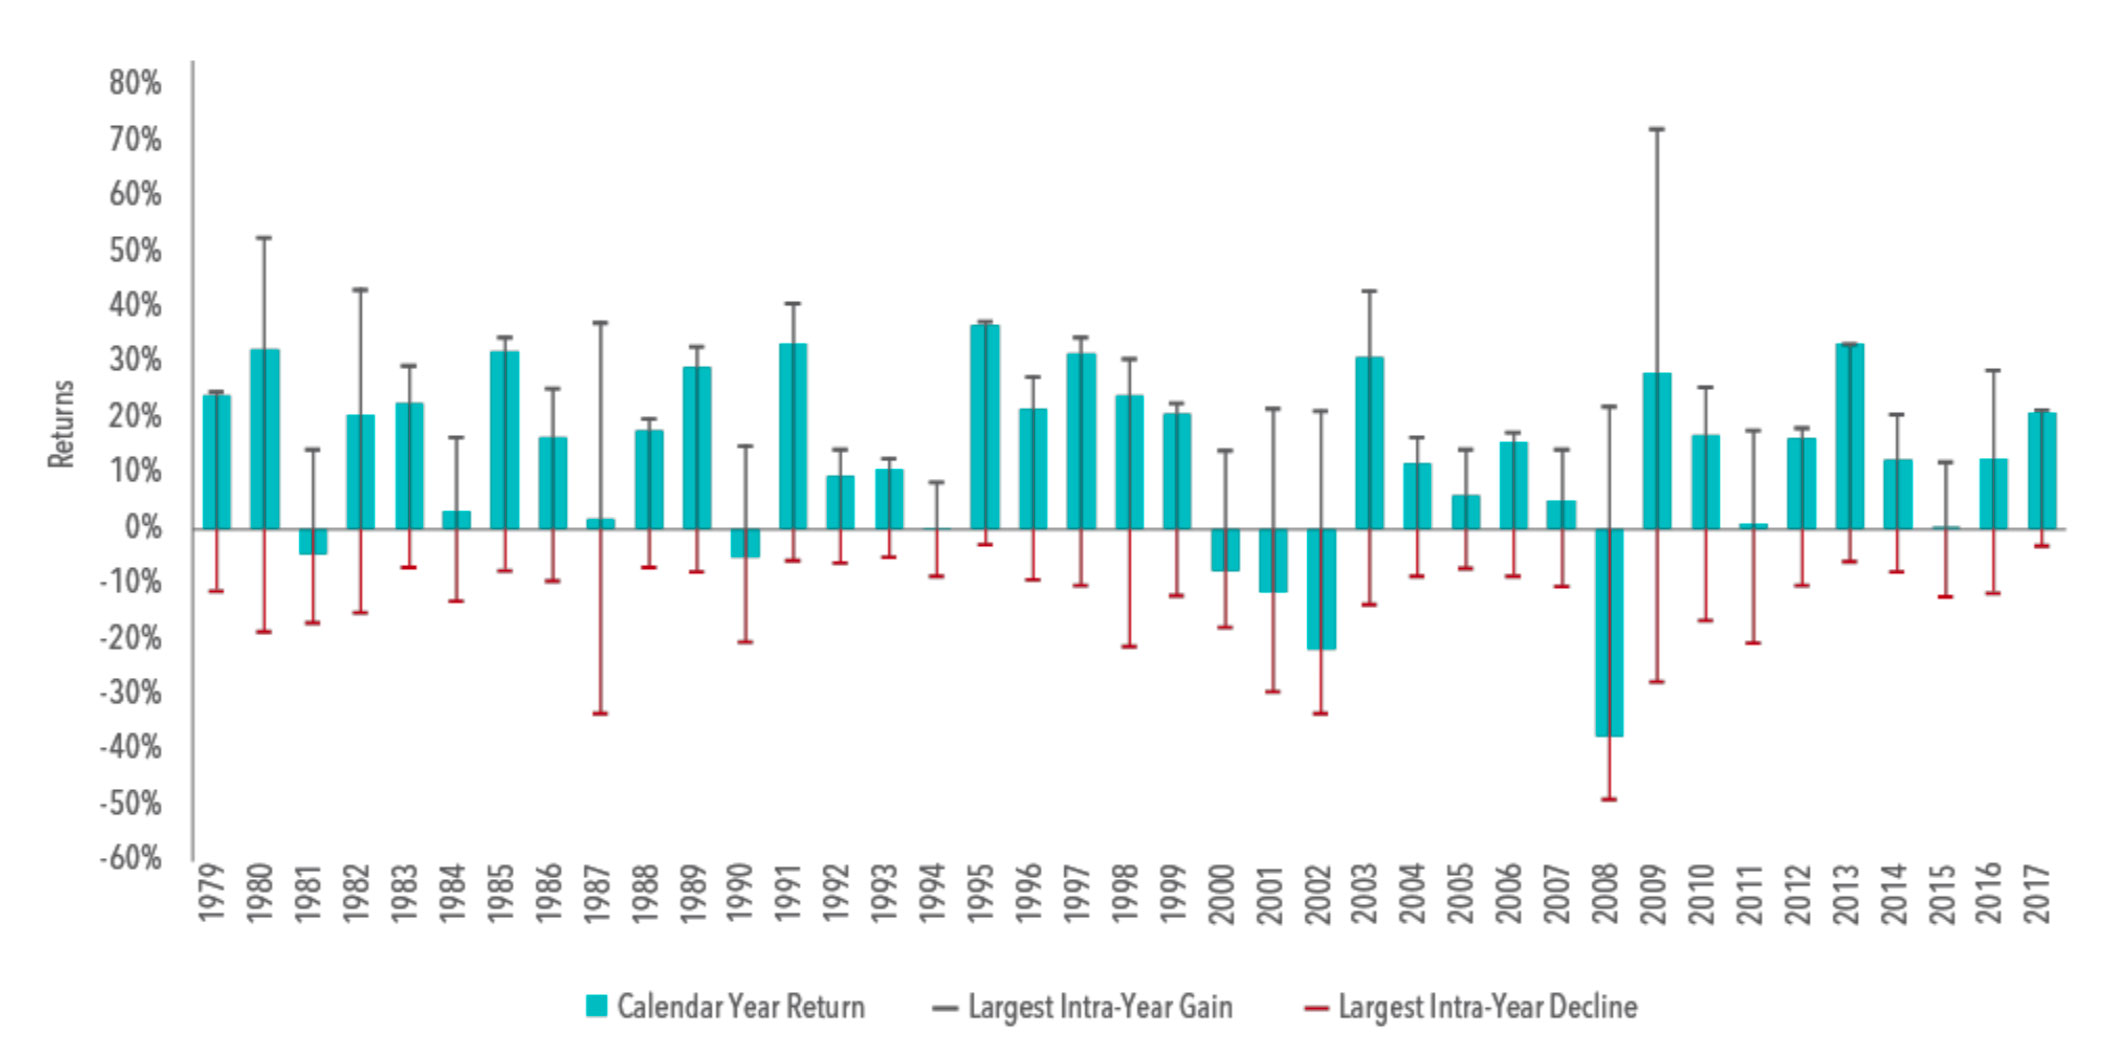
As can be seen, most years the stock market falls at least 10%. About 1/3 of the years the market falls over 15%.
So why don’t we just get out of stocks once they start to fall and get back in after they bottom out? The chart below provides a cautionary note. In particular, the bar chart reports the growth of $1,000 invested in the large US stock market in 1990 compared to doing so but missing out on some small amount of the best number of days.
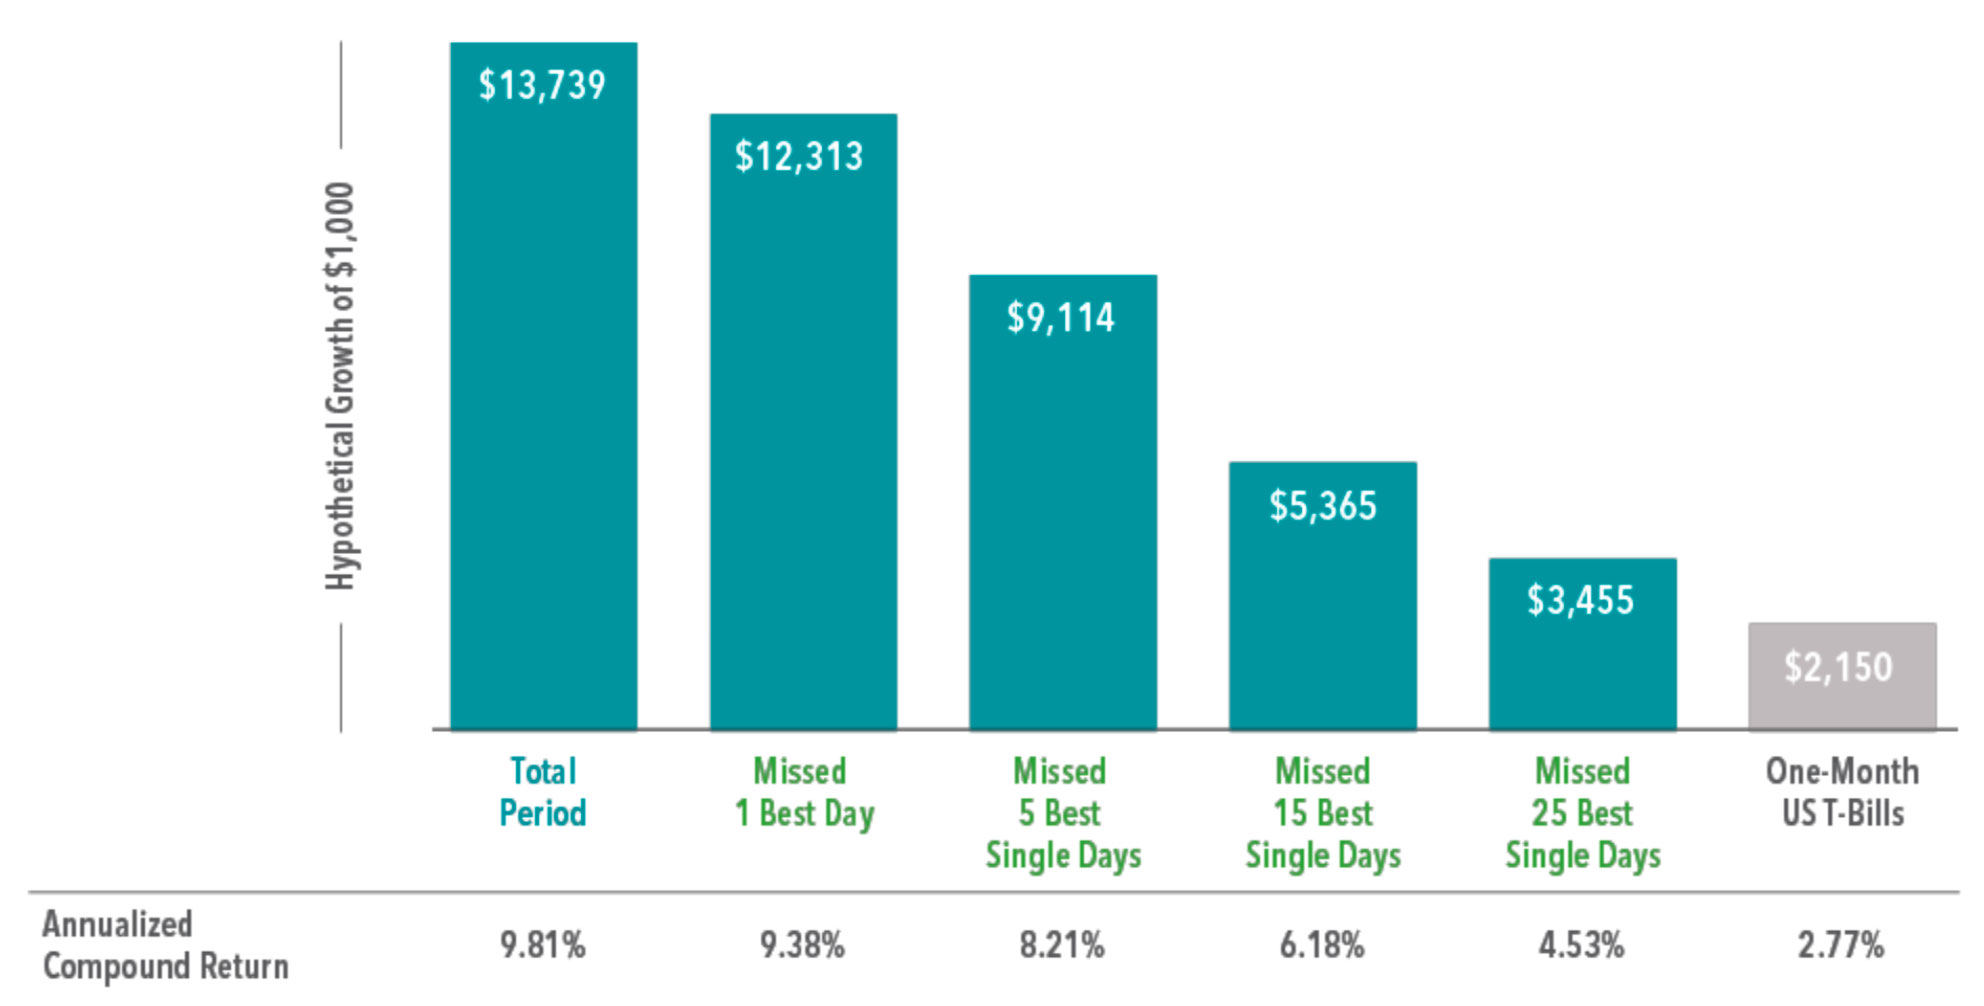
In short, just missing the best 25 days, which is fewer than 1% days, results in missing out on some 80% of the growth compared to simply staying the course. This is why it is so hard to time the market. But aren’t we in trouble if the market falls?
Historically, 70% of “corrections” (i.e., when the stock market falls at least 10%) do NOT result in a bear market (i.e., a fall over 20%). Thus, a correction alone is not cause for catastrophic concern. A more material concern is if we enter into an economic recession, as bear markets are rare without one.
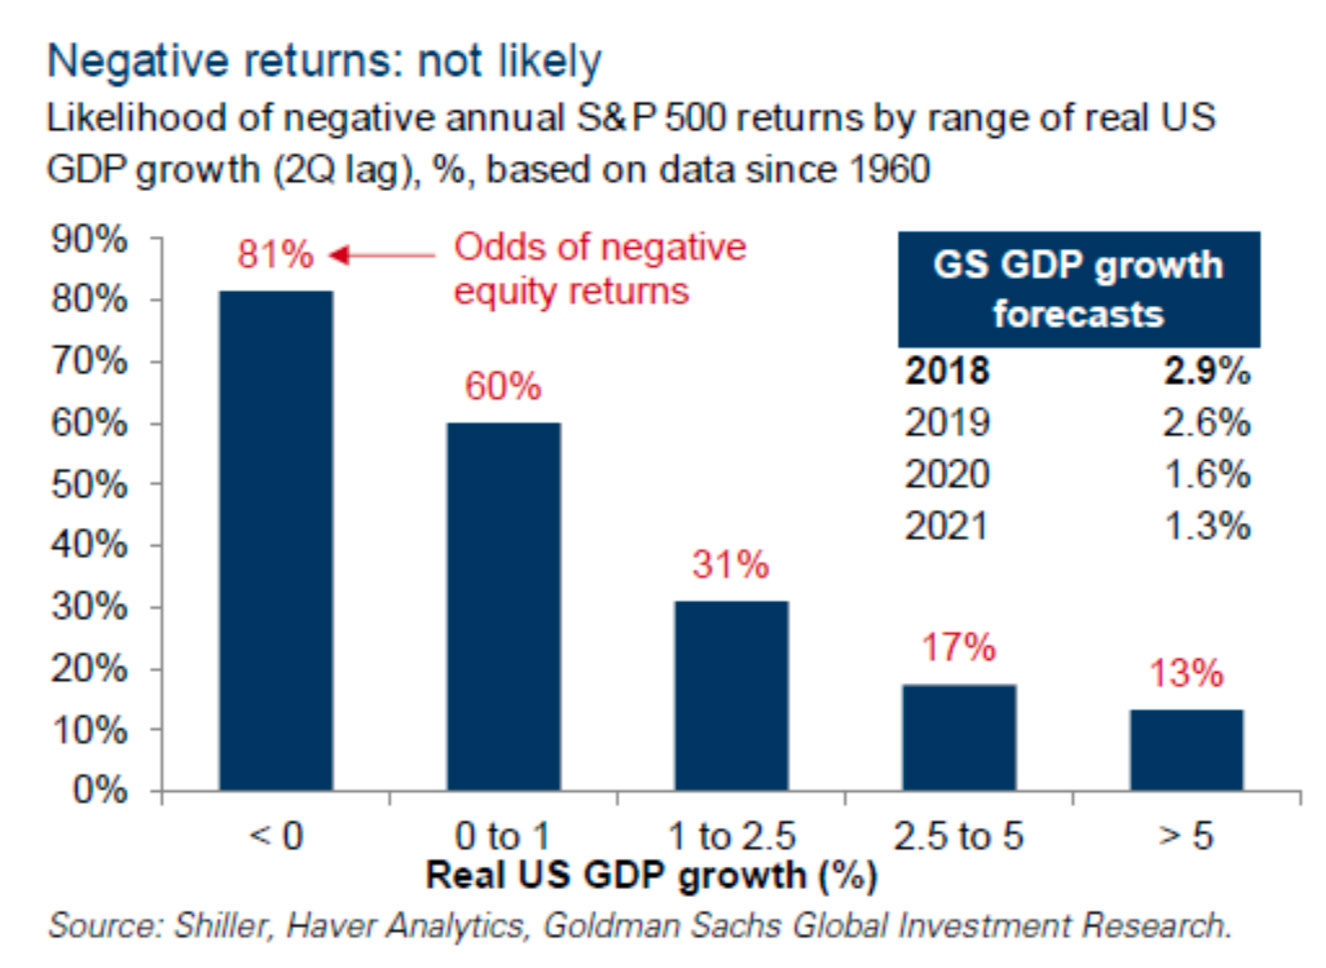
What follows is a chart from Goldman Sachs showing the odds of losing money as a function of GDP growth. As GDP growth turns negative (i.e., a recession), the odds are some 81% that stock returns will turn negative. The forecasted GDP growth for 2019 is 2.6%, which instead suggests around an 80% chance of positive returns in 2019.
Nonetheless, markets do and will fall negative some years. However, as in turns out, it can also be a treat, if you will, to have some market declines. Here are at least three reasons why:
- An opportunity to buy low.There are at least two ways we can buy low, even when we do not know if markets are falling and how far
they have fallen.The first way is through rebalancing a portfolio. In 2009, after stocks had fallen 40-50% we rebalanced from managed futures, which were up some 20%, into stocks. In the end, we had a higher return that if such a stock fall had never occurred. Of course, this approach assumes one has some very different investments that are not all in the “Up” stock bucket. As many of you know, this is precisely the focus our States of the World Wealth Management® approach.The second way to buy low is through dollar cost averaging. The concept is simple but powerful. By systematically investing the same amount of money one can experience a higher return than the investments one invests in. For example, assume you are investing $1,000 per month. When stocks fall, you buy more shares. When stocks rise, you buy fewer shares. Mathematically, you actually end up buying shares lower on average, which can result in a higher-than-market return! - Tax harvesting.Unfortunately, last year (2017) it was difficult to strategically harvest losses, as most all assets classes had positive returns. However, this year a great outcome would be for stocks to fall further so we can tax harvest, and then for them to bounce back after the 1st of January. This would provide more economic benefit than if stocks rebounded before January 1st. For example, assume stocks fall another 5% this year and we harvest losses of around 10% (we review additional potential tax harvesting at the end of each calendar year). We would then realize an economic benefit of perhaps 2-4% of the value of the portfolio this year, depending on your tax situation, even if stocks make another 5% next year. If instead stocks recover next week and continue to charge ahead next year, gaining 5% next year, we will never realize such benefit.
- Limiting bubbles.
The worst recessions are those that come from an overheating economy, and many of the largest stock market crashes fall on the heels of a stock market bubble. Having periods of stock market corrections provides some “relief” to potentially forming bubbles. That is, market declines can provide a relief valve that can prevent a later bursting bubble.In the end, falling stock markets are scary and not fun, if even gut wrenching at times. However, for the steadfast investor that can weather the ups and downs, which is made easier and more successful when complementing stocks with a swath of different kinds of investments, they will be rewarded as they ultimately accomplish their financial goals, which is always a treat.
Thank you for your faith and trust in us over the years, some for even decades. As always, if we can help you or you have any questions or concerns, please don’t hesitate to reach out, as we are here to serve and support you.
This commentary reflects the personal opinions, viewpoints and analyses of the Omega Financial Group, LLC employees providing such comments, and should not be regarded as a description of advisory services provided by Omega Financial Group, LLC or performance returns of any Omega Financial Group, LLC Investments client. The views reflected in the commentary are subject to change at any time without notice. Nothing in this commentary constitutes investment advice, performance data or any recommendation that any particular security, portfolio of securities, transaction or investment strategy is suitable for any specific person. Any mention of a particular security and related performance data is not a recommendation to buy or sell that security. Omega Financial Group, LLC manages its clients’ accounts using a variety of investment techniques and strategies, which are not necessarily discussed in the commentary. Investments in securities involve the risk of loss. Past performance is no guarantee of future results.