
2nd Quarter 2019: Trade Wars Redux: A Short History and a Look to the Future

Dylan B. Minor PhD, MS, CFP®, ChFC, CLU
Chief Strategist and CIO
“Protectionism does not produce wealth, and free trade and economic openness are ultimately in everyone’s interest”
Thomas Piketty, Capital in the Twenty-First Century
“[the capitalist class] has resolved personal worth into exchange value, and in place of the numberless indefeasible chartered freedoms, has set up that single, unconscionable freedom—Free Trade”
Karl Marx, The Communist Manifesto
Trade wars have raged since the beginning of commerce.1 An early example includes King William of Orange, who enacted steep tariffs on French wine in an attempt to induce Englanders to produce and consume more English gin. It worked too well. There were reports of his subjects spontaneously combusting due to huge quantities of English gin consumption. The tariffs were ultimately removed and French wine again began to pour into England. Perhaps the most famous US trade war was the Boston Tea Party, which helped push our country into independence. In addition, it inspired the lesser know Edenton Tea Party of North Carolina, which consisted of a brave all-women group repeating the Boston exercise in North Carolina. Not much later Britain got involved in the Opium wars, which began as an economic trade war. Britain was unhappy with its large trade deficit with China, partially created from Britain’s prodigious level of Chinese tea consumption. Britain started to close this trade gap by exporting opium to China, helping create an opium epidemic in China. An unhappy China seized over 1,000 tons of opium and destroyed it. The conflict ultimately escalated to a naval war.
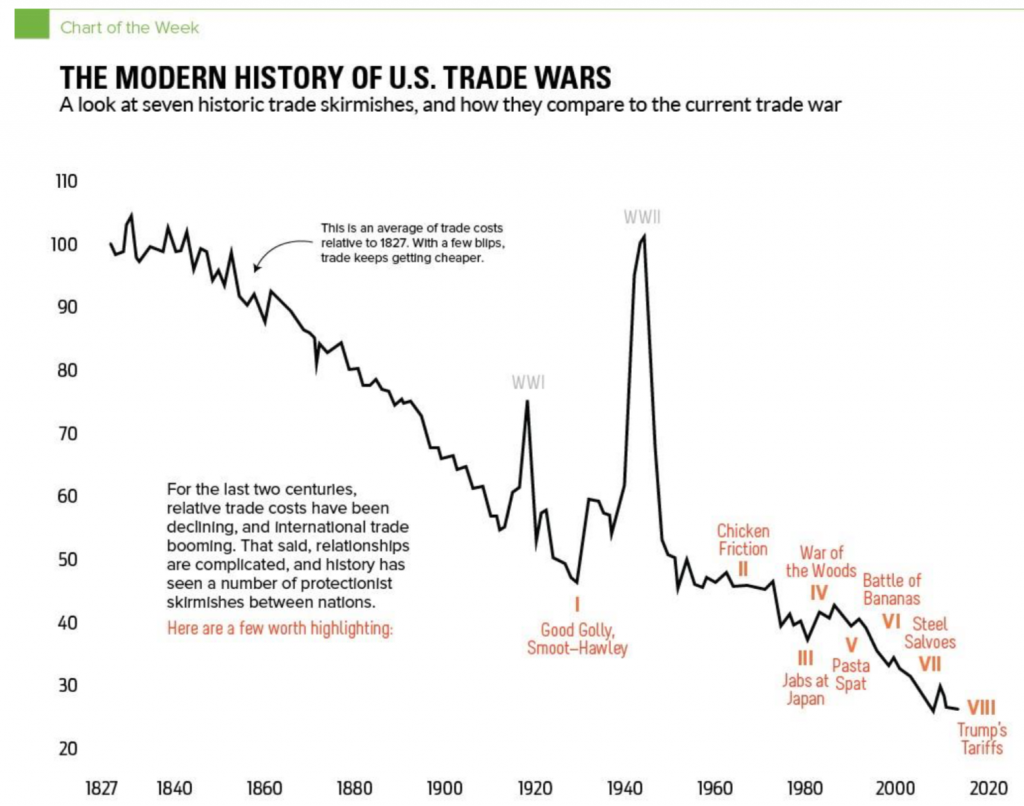
The US has also engaged in many trade wars. Fortunately, none besides the Boston Tea Party escalated to a formal war. The chart below, from The Visual Capitalist, plots the estimated cost of US global trade over time, normalized to a starting value of 100 in the early 19th century. Although the cost of trade has been punctuated by trade wars and formal wars, the cost has fallen some 75%.
The US has engaged in trade battles over everything from chickens to bananas. Similar to the recent trade war with Trump that started partially over steel, in the early 21st century steep steel tariffs were introduced by George W. Bush to protect the steel industry. That time, the tariffs lasted approximately 18 months and economically economists estimate the net effect as close to zero.
Typically, the US uses a trade war to protect a certain industry (e.g., the steel industry) or as a stick to force negotiations of some commerce issue. The current trade war, which has focused primarily on China, aims to force China to improve its poor business practices, such as stealing US intellectual property and inhibiting foreign company entry. Of course, there is a cost to the US in having a trade war, as it introduces economic frictions. Thus, the overall net costs of a trade war are uncertain ex-ante. Nonetheless, in the long-run, most are not helpful economically, which is why most of us economists generally oppose them.
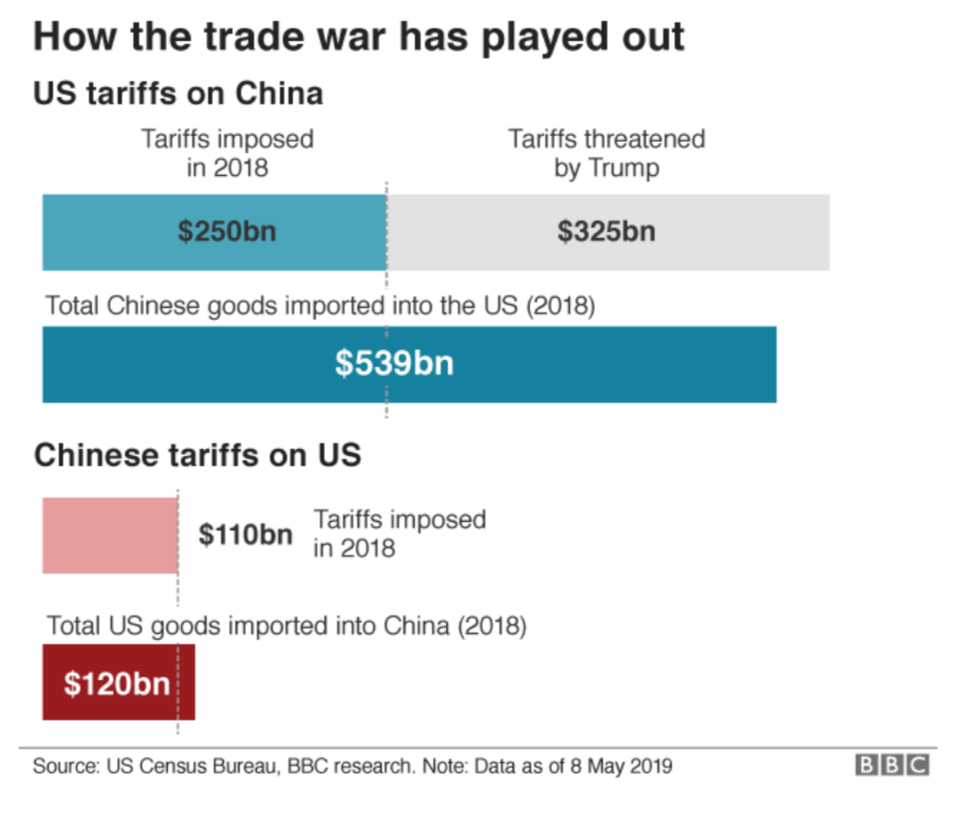
The following chart from the BBC shows how much of a stick the US and China have created in this current trade war. Last year, the US purchased over $500 billion of Chinese goods, whereas China only purchase approximately $100 billion of US goods, which means there was about a $400 billion trade deficit. In terms of tariffs, this means the US can tax China much more than China can tax the US. So far, the US has taxed approximately 50% of the goods it has been purchasing from China (i.e., approximately $250 billion worth). China is currently taxing close to all of the goods it purchases from the US (i.e., about $100 billion). This means that the US can still impose a much larger stick than it is currently, whereas China is about capped out. To be sure, countries can threaten another country in other ways, but in terms of taxing trade flows, China is about out of options.
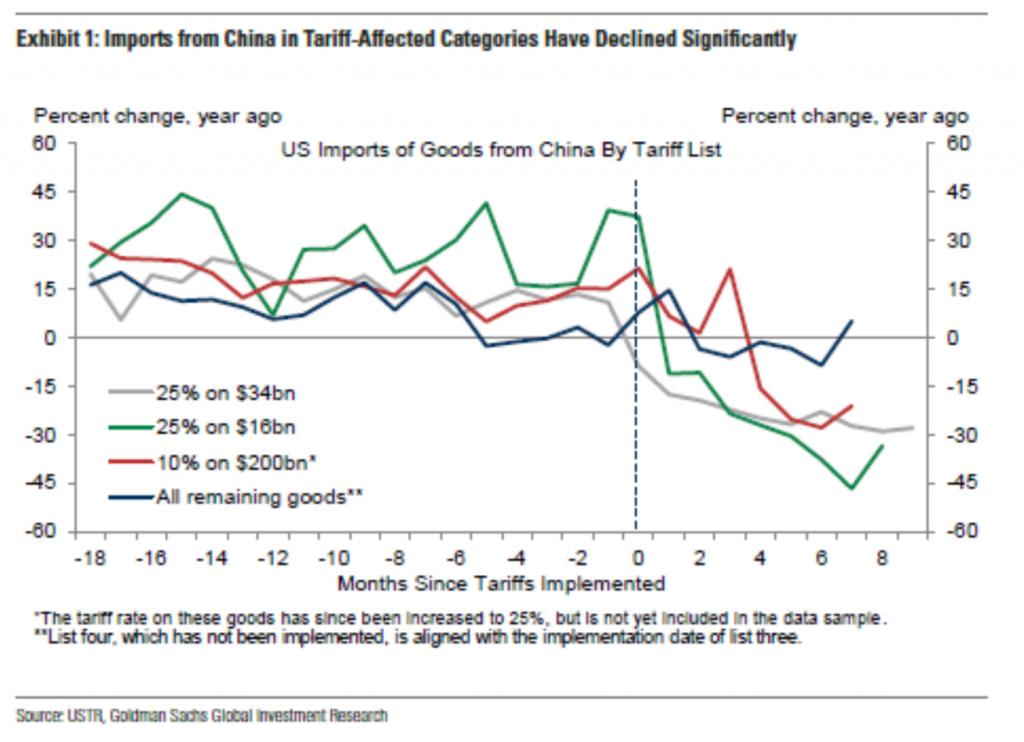
So how have these tariffs affected China’s exports to the US? Dramatically. The chart below shows that those goods that the US has subjected to tariffs have fallen in sales by some 30-40% versus no change for those goods not (yet) taxed.
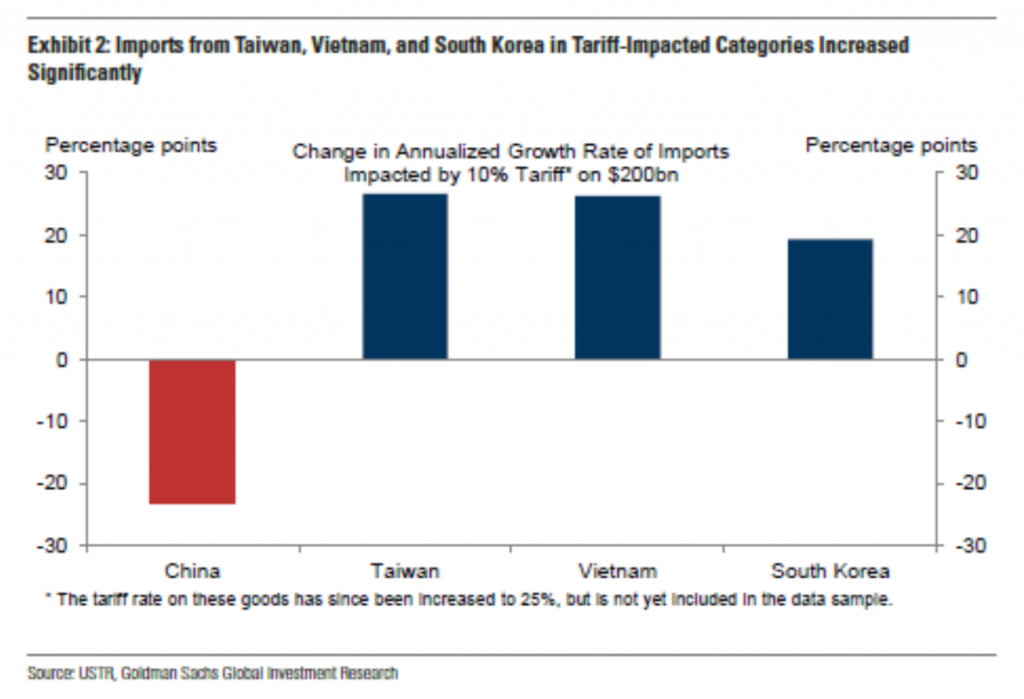
The chart below suggests that the US is still purchasing these goods that are being taxed, but from other countries such as Vietnam. There has been an increase in Chinese exports to Vietnam, which hints that perhaps China is simply pushing their goods to the US through Vietnam. However, this can only account for a fraction of the increase.
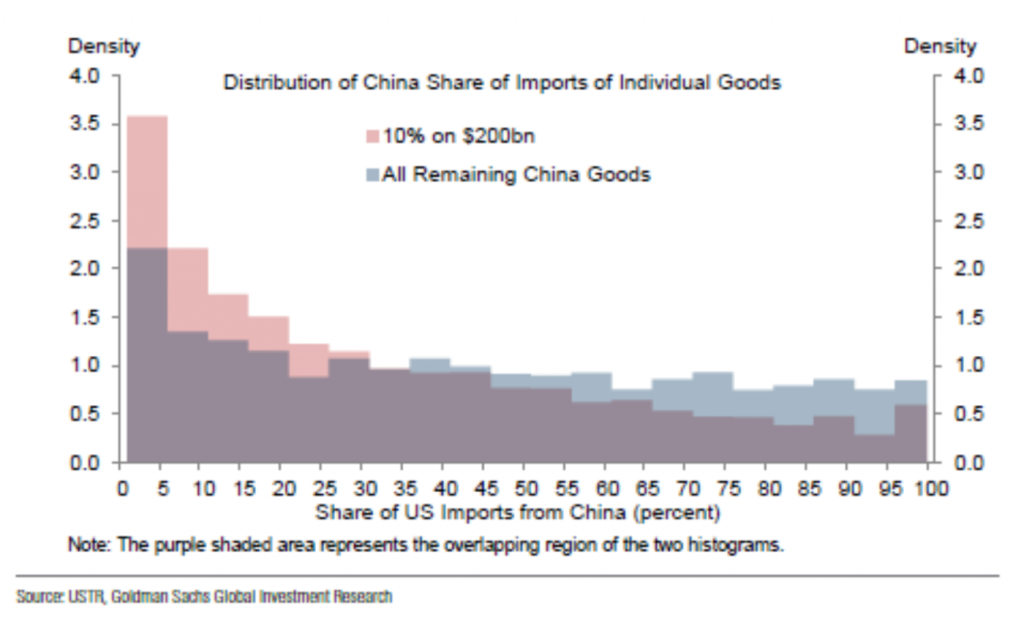
So in short, the tariffs so far have apparently worked well to impose some economic costs on China. However, any additional tariffs are likely to prove more costly to the US. The imported goods not yet subjected to tariffs by the US are goods that are mostly available only from China (see the chart below). This means that either the US will continue to purchase them post tariffs, but with substantial inflation, or instead purchase poorer substitutes. Neither of these outcomes are good for the US.
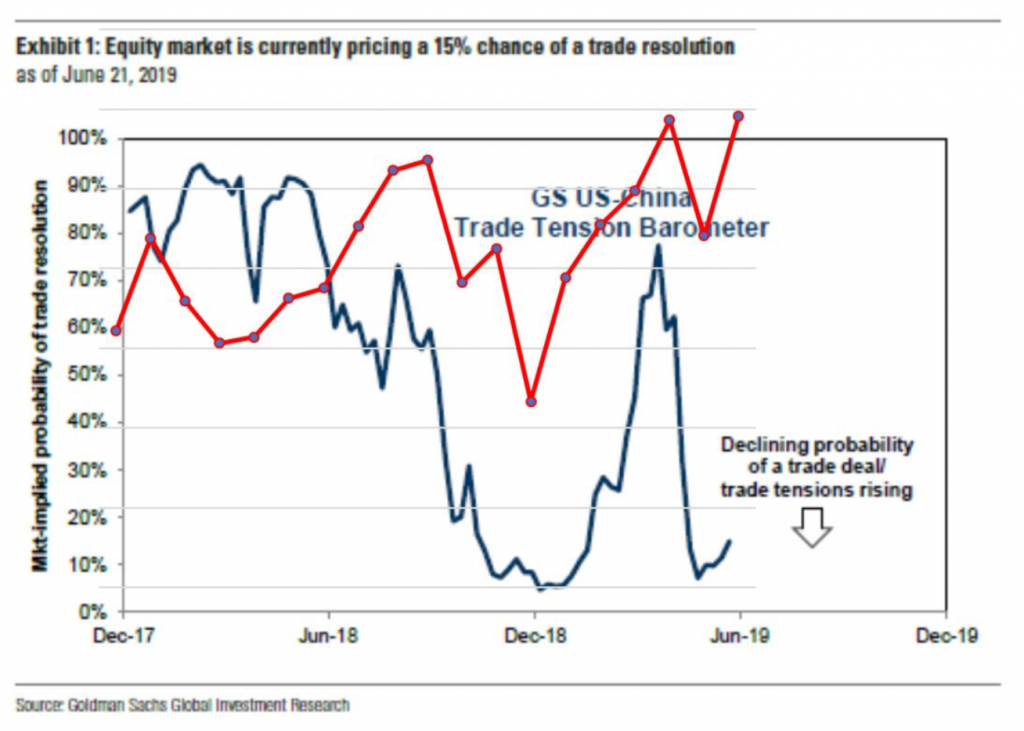
Not surprisingly, then, the stock market has started to move almost in lock-step with how likely investors believe the trade war is to be settled.
On the below chart, I plotted the returns of the S&P500 in red against the implied probability of a trade deal, as implied by the investment markets. As can be seen, since last Summer, the stock market has very closely followed the expectations of the resolution of the trade war, with increased likelihood of resolution encouraging positive US stock market returns.
Currently, if one can predict what will happen next month with the likelihood of ending the trade war, she would likely predict the direction of the stock market. However, forecasting this outcome is difficult. Or is it? I think it is really quite easy: we know for sure that the tariffs will go up, go down, or stay the same next month. This should sound familiar, as it is another version of our trademarked States of the World Wealth Management® process, which, rather than predicting various financial market, strives to maintain positive exposure to different possible economic outcomes.
In this spirit, we have different kinds of investments that can have negative or positive returns as a function of the likelihood of trade resolution (and some investments that can have almost no relationship at all to trade). The following chart reports the correlation between our primary core investments at Omega and investors’ perception of the likelihood of trade resolution each month, over the past 18 months.
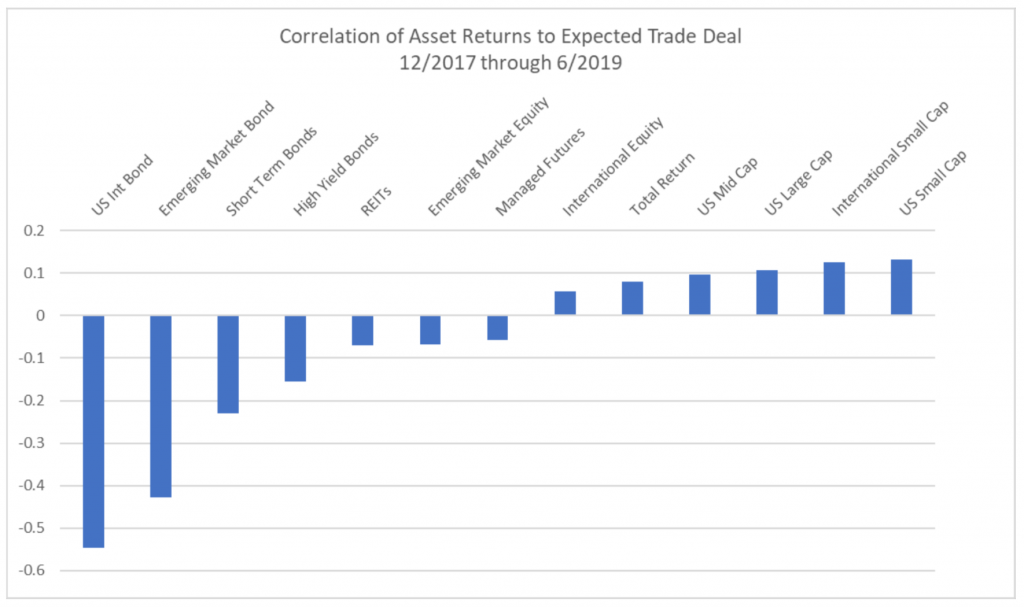
As can be seen, some of our investments like Emerging Market bonds and US intermediate bonds have tended to be negatively correlated with the probability of a trade deal, meaning they tend to have positive returns when the markets are more pessimistic of trade resolution. In contrast, during the same period of expectation, most all stocks tend to fall in value. And then as investors believe a trade deal is likely, just the opposite happens.
So when will there finally be a trade deal? It likely will take a bit of time. The G20 meeting in Osaka, Japan provided an opportunity for President Trump and Xi to begin a conversation on trade again. However, it seems it was more the beginning of a conversation rather than a road to resolution. Meanwhile, we at Omega are allocating to truly different investments so that we do not have to wait for a trade deal to still meet your financial goals, as we know, for sure, that next month tariffs will be higher, lower, or the same.
Omega Financial Group LLC is a Registered Investment Adviser. This commentary is solely for informational purposes. Advisory services are only offered to clients or prospective clients where Omega Financial Group LLC and its representatives are properly licensed or exempt from licensure. Past performance is no guarantee of future returns. Investing involves risk and possible loss of principal capital. No advice may be rendered by Omega Financial Group LLC unless a client service agreement is in place.
- The examples in this paragraph are taken from npr.org.