
2nd Quarter 2018: The War Intensifies: China vs. United States
Many have continued to show deep interest and concern around the so-called trade war between China and the United States. As such, for this quarterly commentary, I want to bring you up to date on what has happened, what will likely happen, and its consequences. I will do so by answering a collection of common questions.
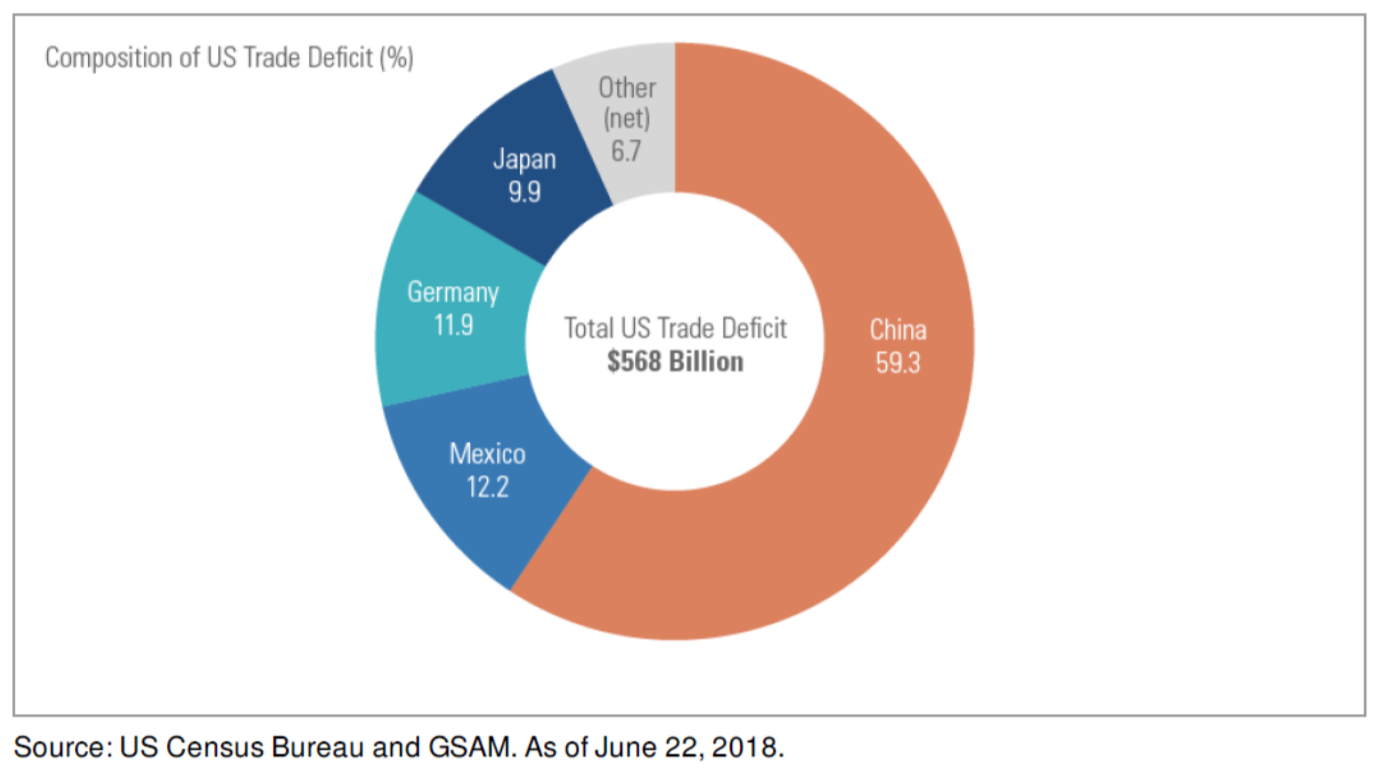
Why is there all this fuss about China and trade?
It turns out that China causes the majority of our trade deficit. Indeed, as shown in the above chart, almost 60% of the $568 billion more we buy from other countries than they buy from us is a result of China alone. And this deficit has grown over the past few decades (see my last commentary here). China has also distorted trade beyond a purchase imbalance. As the Economist magazine reports:1
“China…has distorted trade on a scale that is far bigger than the dumping and other causes of disputes of market economies that the World Trade Organization (WTO) was designed to handle…China’s state- owned firms and its vast and opaque subsidies have distorted markets and caused gluts in supply for commodities such as steel. Foreign firms operating in China struggle against heavy-handed regulation, and are required to hand over their intellectual property as a condition of market access”
So the fight began, using the weapon of trade tariffs. And the fight has escalated.
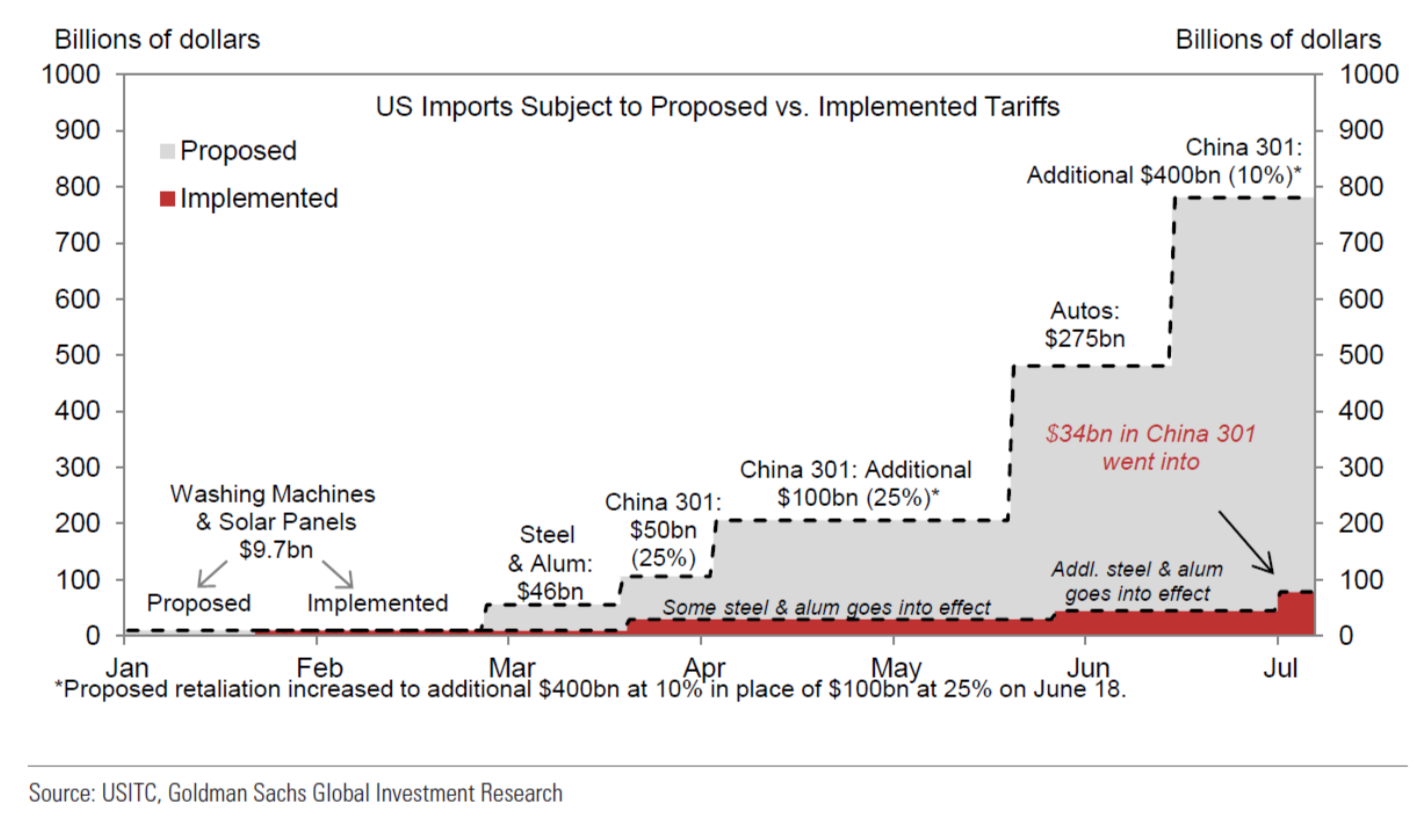
Where is the fight now and how far has it come?
The chart below reports how the trade war with China has unfolded this year. The US began the year by threatening China with trade tariffs on solar panels and washing machines, which covered just $9 billion of trade. These small tariffs have been implemented. Next, steel and aluminum tariffs of a bit less than $50 billion were threatened and now have largely gone into effect. The most recent escalation is to add a whopping $400 billion of additional goods subject to tariffs. China has responded by about as much as they can (roughly $150 billion), as this is essentially the sum total they purchase from the US annually.
How do these current proposed tariffs compare to historical values? Interestingly the current proposal puts us back to the late 1960’s, in terms of effective tariffs:
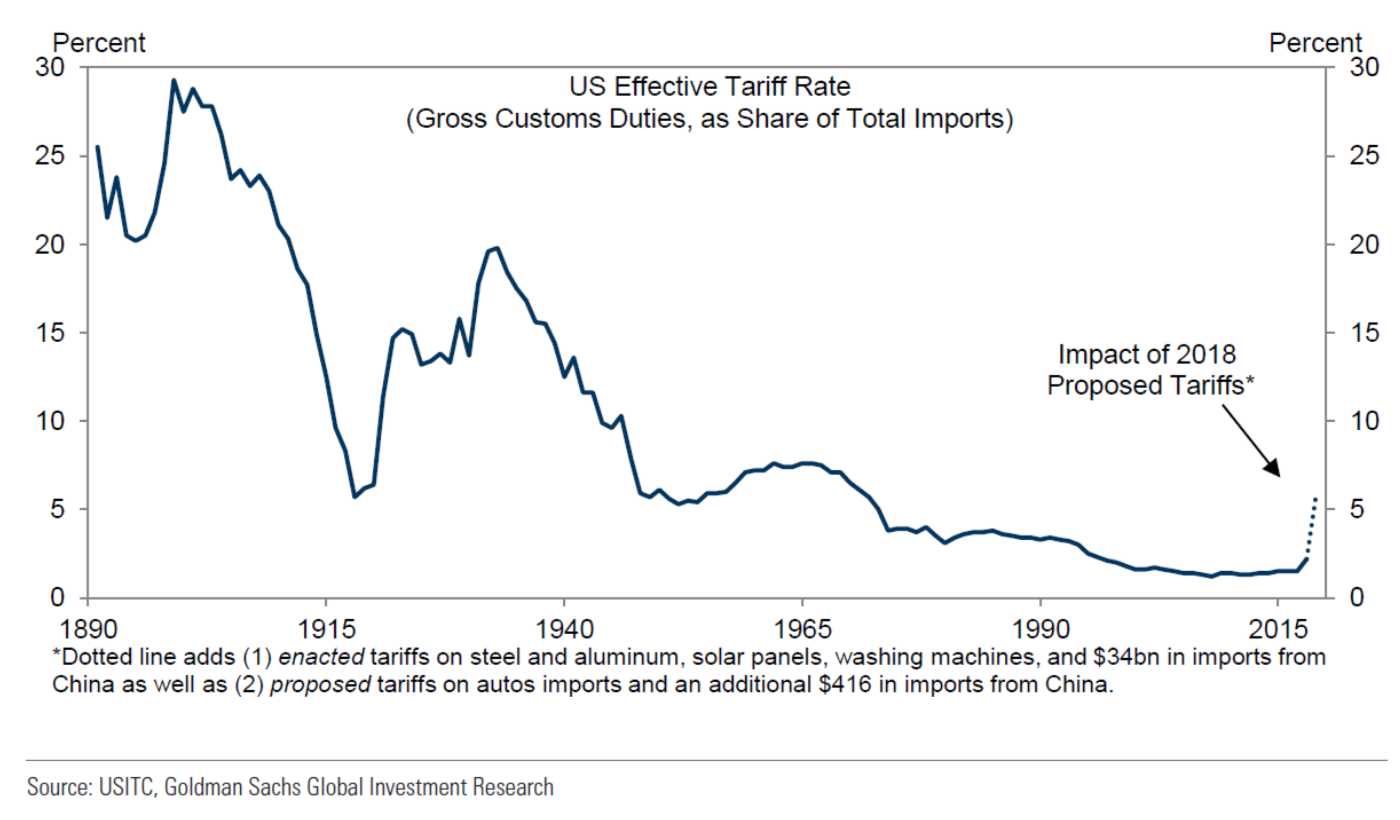
It is also interesting to note how protectionist the US was during the beginning of the 20th century, and then again until after World War II, after which we’ve enjoyed continual progress towards free-trade.
What does this all likely mean for the US economy?
A simple version to help understand how much of an impact all this might have is reviewing the breakdown of the US economy. Using data from the Bureau of Economic Analysis, we have the following pie chart:
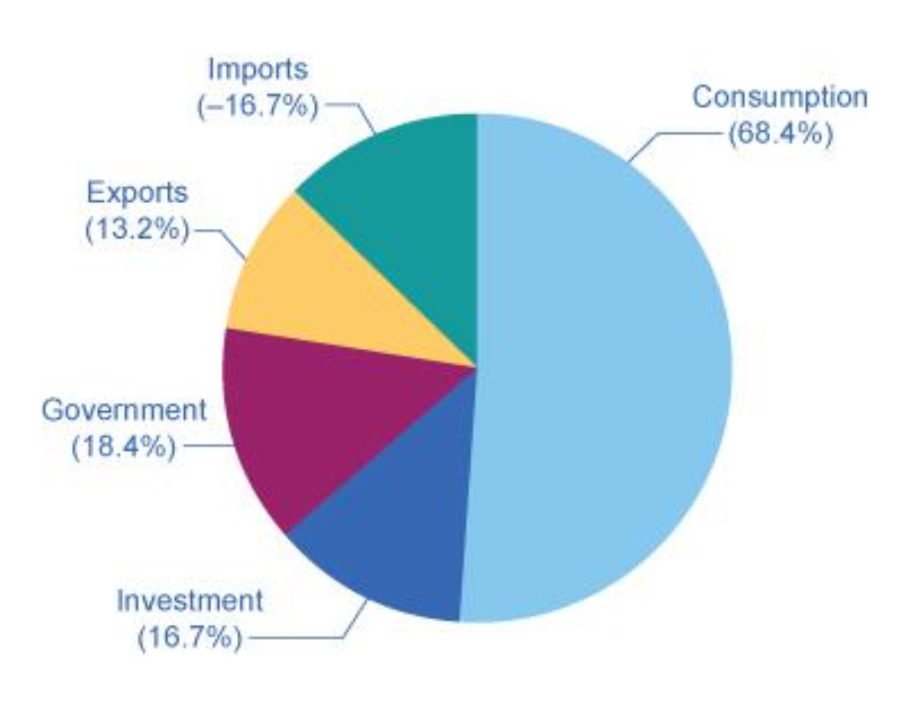
This shows us that most of the change in the value of the US economy is simply driven by individual consumption: what US consumers are buying. While consumers represent almost 70% of the economy, net trade is less than 6%. And it is negative. That is, the net impact on the economy of trade is differencing the exports (+13.2%) and imports (-16.17%). When the US adds a tariff on Chinese imports, this could increase the US economy as US consumers choose to buy US goods and services over now more expensive Chinese ones. However, US consumers might also simply choose to purchase from a different country, which then leaves the economy little changed. If China then also adds a tariff on imports from the US, that means our exports to China are going to be taxed and the Chinese consumers and businesses might buy less of our goods, which means export will Fall. However, in terms of the overall contribution of trade to the economy, it is the net difference of exports and imports. Since this net contribution is a small part of the overall US economy, this suggests that a tariff on trade might not be that significant.
For a more sophisticated assessment of the situation, Goldman Sachs has done some excellent analysis to estimate the likely effects on four aspects of the US economy, assuming the trade war is truly war with both sides enacting their respectively proposed tariffs:
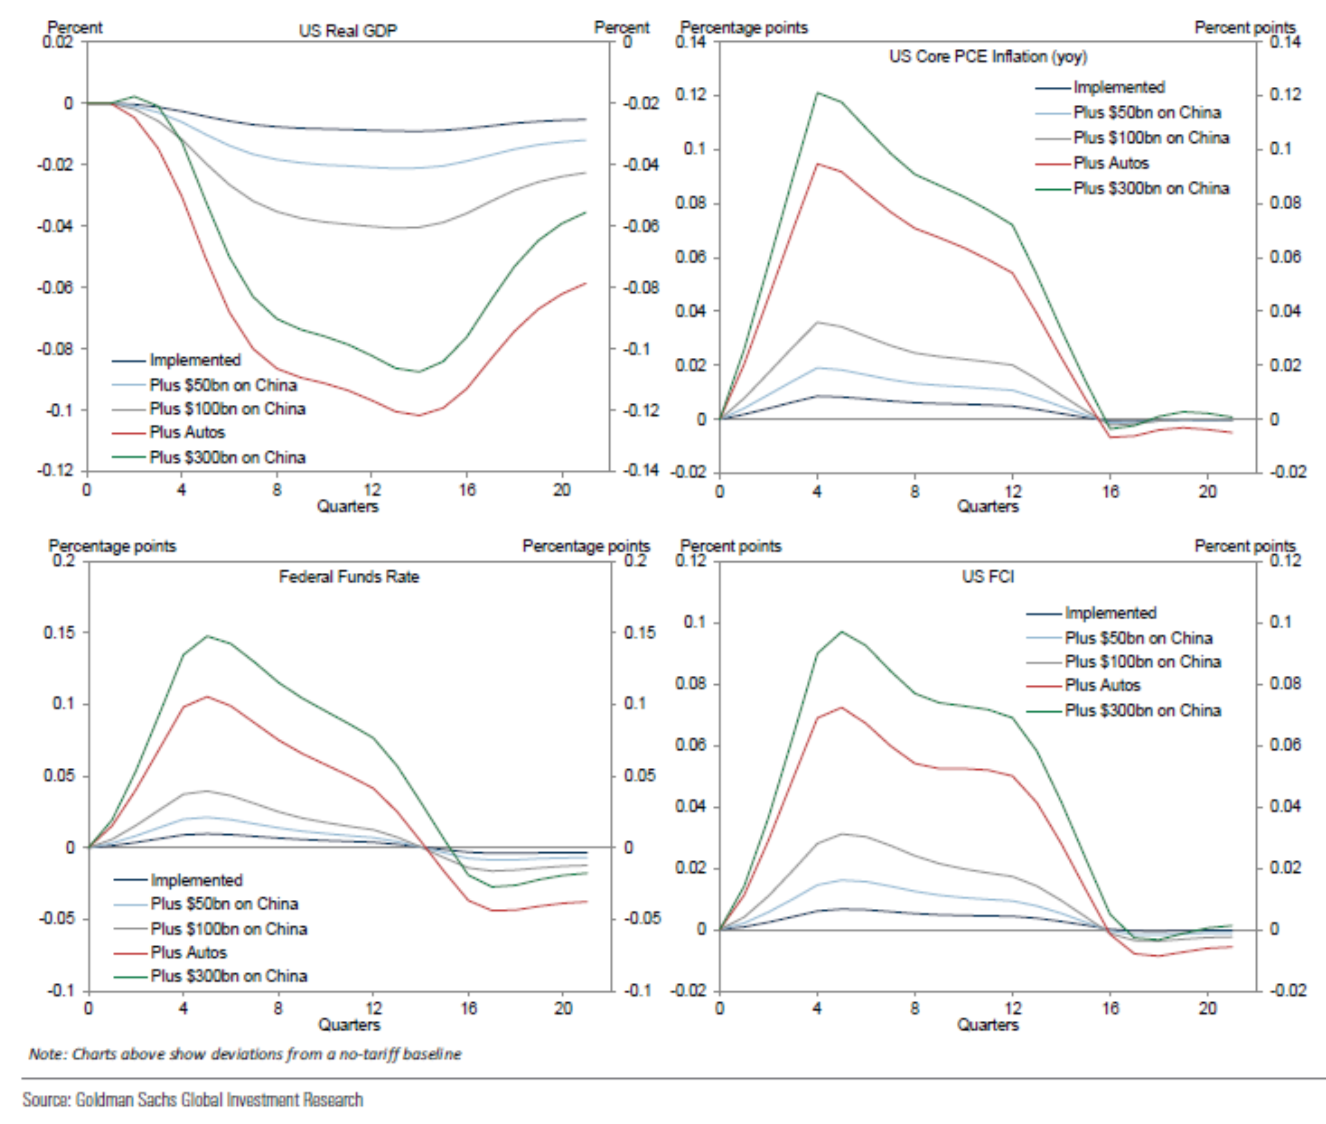
These four panels show the expected impact on the overall US economy (US Real GDP), inflation (US Core PCE Inflation), the Fed Rate (Federal Funds Rate) and overall tightness of financial conditions (US FCI), where a larger number is worse for the economy, as denoted by tighter financial conditions. With an expected GDP of 2.5% or so, both sides enacting all of their proposed tariffs generates an average of .1% or so economic impact, which is not significant in the overall picture. In contrast, if only the currently implemented tariffs are maintained, the effects amount to a rounding error on overall US economic output. All the while, inflation and the Fed Rate are expected to receive upward pressure from such tariffs.
What else might happen besides tariffs?
China also has additional means by which to inflict economic harm on the US. Specifically, the two most widely cited measures are for China to depreciate its currency and to sell off some of its extensive US Treasury Bond holdings. Although both of these measures would harm the US economy, selling off US Bonds would actually harm China’s GDP, whereas depreciating its own currency would materially help it in terms of increased GDP. Thus, only the use of the latter action seems likely.
Who will win the war?
Assuming in addition to full proposed tariffs implemented, China depreciates its currency 5%, and global stocks fall 10%, China and the US lose equally: they both lose about .5% of overall economic output over 3 years. This is not likely enough to push the US into a recession, but it is a modest effect. In the end, however, it looks like the trade war may be a draw, with the US possibly winning if the weapons remain only trade tariffs.
What has been happening to the economy and financial markets?
Meanwhile, how has the economy been holding up during the trade war? One of the purest ways to measure how the economy has been doing is how many people are unable to find work that want to work: people that have jobs make money and spend it, which is the largest driver of the US economy, as shown above. One measure of the health of employment is the number of unemployment claims filed. Mostly recently, remarkably, this measure was reported to be the lowest it has been since the late 1960s. Thus, both trade tariffs and unemployment claims are at late 1960’s levels. This is a curious coincidence, as the former is poor for the economy and the latter a sign of significant economic strength. However, employment is a lagging indicator of how the economy has been doing. The financial markets, in contrast, tend to be a leading indicator, a harbinger of our future economy.
So how have the financial markets digested the trade war so far this year? Most markets are flat to down. One of the worst markets is Emerging markets, which are down some 7%. The best market has been US smallcap, which is up some 6%. Most bond markets are flat to down. Thus, overall, global markets are flat to down year-to-date. This all suggests, the US will lead the world economically, although it will perform modestly.
How might this all end?
To be sure, over the long-run, every country wants maximal access to trade. As the Economist magazine puts it: “It is in China’s interests to preserve the global trading order because if China is isolated, the Communist party cannot achieve the prosperity that cements in legitimacy.”2 The ideal outcome, in my view, would be for these trade wars to lead to an improved WTO that can provide a more effective place for settling trade disputes, to help maximize our global free-trade. Of course, this might not be the outcome of the current trade war. And so it is we invest in different things that do better in up, down or flat markets through our proprietary States of the World Wealth Management® approach. As always, do not hesitate to write or call with any questions or concerns.
- Economist Magazine, July 21st 2018, page 9.
- Economist Magazine, July 21st 2018, page 9.
This commentary reflects the personal opinions, viewpoints and analyses of the Omega Financial Group, LLC employees providing such comments, and should not be regarded as a description of advisory services provided by Omega Financial Group, LLC or performance returns of any Omega Financial Group, LLC Investments client. The views reflected in the commentary are subject to change at any time without notice. Nothing in this commentary constitutes investment advice, performance data or any recommendation that any particular security, portfolio of securities, transaction or investment strategy is suitable for any specific person. Any mention of a particular security and related performance data is not a recommendation to buy or sell that security. Omega Financial Group, LLC manages its clients’ accounts using a variety of investment techniques and strategies, which are not necessarily discussed in the commentary. Investments in securities involve the risk of loss. Past performance is no guarantee of future results.