
2nd Quarter 2017: The Efficacy of Managed Futures
Dylan B. Minor PhD, MS, CFP®, ChFC, CLU
Chief Strategist and CIO
A Riddle and Its Solution
We have witnessed another strong quarter for equities, across much of the world. In times like these, it is natural to wonder why we have anything in our portfolio except equities. In this spirit, I wanted to use this quarter’s commentary as an opportunity to discuss the asset class that has fared most poorly in our portfolios, as of late: managed futures.
How about the idea of having an investment that is high risk and low return? This is precisely what we recommend in allocating a portion of our portfolios to managed futures. Whereas from January 1994 through May 2017[1] large US stocks (i.e., SP500), as proxied by the exchange traded fund (ETF) SPY, has had an annual average return of about 10% with risk (i.e., standard deviation of returns) of about 14.5%, managed futures, as proxied by the Credit Suisse Managed Futures index, obtained about 5.25% average annual return with about 11.5% risk. In other words, for this period, managed futures carried about 80% of the risk and yet yielded only about 50% of the return of the SP500. How could it make sense to add this investment to a portfolio of large US stocks?
The missing piece to this riddle is the lack of correlation between these two investments. For the above period, the correlation was about -.07, which means the return of one is investment not at all associated with the other: when one zigs, the other might zig, zag, or simply stand still. In contrast, a typical large stock mutual fund might have a correlation of around +.9 to the SP500, which statistically means over 80% of the return in any given month or year is tied to the movements of the SP500. This compares to just .5% of managed futures’ returns being tied to the SP500 returns.
Although managed futures provide a good opportunity to truly diversify a portfolio of US stocks, it tends to provide the most value-added during periods of negative US stock market returns. For this period studied, I found that negative return months happened approximately 36% of all months for the SP500. The average annual return of these negative periods was a dismal -35%. However, the average annual return for managed futures during these same months was just almost +6% per annum. As some of our clients will remember, in 2008, when stocks fell around 35-50%, depending on which particular market, the average managed futures fund was UP almost 20%. The most recent time investors had a material scare of another bear market was last year January 2016. Indeed, during this month the SP500 fell roughly 5% and the media spoke of this as the beginning of a slide into another 2008. Meanwhile, the average managed futures fund was up about 4%. However, since then, the SP500 has been on a tear: Indeed, it has had only a single material down month. That is, about 10% of the months have been down versus its historical 36%.
With our States of the World Wealth Management® process, it is important to have investments that can survive if not thrive during all three states: flat, up, or down. It is the latter state for which we allocate to managed futures. For our clients that withdrawal funds on a regular basis, this feature of managed futures is especially important, as we can limit the potential adverse effect of taking money out of a portfolio in a down market.
Another important reason we use managed futures is that they help us better reduce variance of returns, which, ceteris paribus, increases the certainty to which we can help our clients meet their financial goals. Not many investments have essentially a zero correlation, on average, with the stock market. However, managed futures is one of them.
A final reason we use managed futures is that they have essentially no correlation to the stock market, which means they can lose money when stocks make money or are flat. When we have different investments that behave this way, we receive a large “rebalance bonus” over time. That is, we have a real opportunity to sell high and buy low by taking some money from stocks during such a period and adding it to managed futures. Then, when stocks have a bad period, managed futures have the potential for a good period, all the while the exposure to managed futures was previously purchased at a reduced price when they were out of favor. Similarly, for our clients with taxable accounts, this type of return behavior of managed futures also helps with increased opportunity for tax harvesting. Even better is if managed future lose money in an up year for the stock markets, as this most likely means an up year overall for a client’s portfolio, and yet we can still harvest some tax-losses from managed futures, which increases the after-tax return over the portfolio.
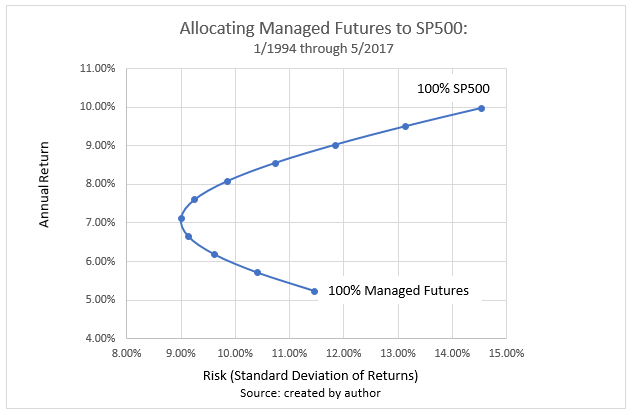
The following chart shows how adding managed futures to a portfolio can help improve the risk/ return characteristics of a portfolio of stocks. If one invested all of her money in stocks (i.e., SP500), she would have earned roughly 10% per annum with risk (i.e. ,standard deviation of returns) of 14.5%. In contrast, placing all of her money in managed futures would have returned roughly 5.25% per year with risk of 11.5%. If she wanted to have a minimal risk portfolio using these two assets, she would have allocated 60% to managed futures and 40% to the SP500, yielding a roughly 7% return with 9% risk. Allocating 40% to managed futures and 60% to SP500 resulted in a portfolio with the greatest return for the risk being taken: about 8% per annum with 10% risk.
So then how much should one invest in managed futures? The right answer depends on how many other alternative assets one can use beyond simply using stocks and bonds, the necessary rate of return to meet one’s financial goals, and one’s risk preferences. We typically use about 8-15 different kinds of assets for a given client, depending on their needs. In the end, we find that all of these factors result in a typical allocation of 5-15% to managed futures.
An Omega Financial Group financial advisor can use our States of the World Wealth Management® process to determine the right allocation for you. And they can utilize our Optimized Wealth Integration® approach to determine how to best link the allocation decision to your overall financial needs and goals. As always, do not hesitate to write or call any of us at Omega to help answer any questions or concerns.
[1] We use this period because it is the period for which data for the managed futures index exists.
Omega Financial Group, LLC is a Registered Investment Adviser. This article is solely for informational purposes. Advisory services are only offered to clients or prospective clients where Omega Financial Group, LLC and its representatives are properly licensed or exempt from licensure. Past performance is no guarantee of future returns. Investing involves risk and possible loss of principal capital. No advice may be rendered by Omega Financial Group, LLC unless a client service agreement is in place